Where Would We Open a Café With $150,000?
Locatalyze Research Team
Location intelligence, Locatalyze
Ask where to open a café with $150,000 and every answer stops at the same place: it depends on location. We scored 614 Australian suburbs to find out what it actually depends on, and the budget turned out to be pointed at the wrong decision. More than half the suburbs that rate GO for a café sit at rent pressure 4 or below, and not one of the fourteen dearest suburbs in the country reaches GO at all. What $150,000 really rations is the condition of the room you walk into — where the gap between a trading café and a cold shell is $161,000 on our model, and invisible on a listing.
How to read this article
**FACT** — a figure from a named, linked source, or our own calculation over a named dataset with the method stated. **LOCATALYZE ANALYSIS** — our reading of that evidence. **INFERENCE** — a reasonable conclusion that is not proven. Suburb figures are computed from the Locatalyze suburb layer described under [Method](#method). Cost figures come from published Australian trade and government sources, listed under [Sources](#sources).
The question has the wrong shape
Ask the internet where to open a café with $150,000 and you get the same four paragraphs every time. Buy a coffee cart. Take over an existing site. Avoid the CBD. Find somewhere with foot traffic. Then the article stops, because the next sentence would have to name a place, and naming a place requires having looked at places.
We have looked at places. Locatalyze scores 1,111 Australian suburbs for café, restaurant and retail viability, and 614 of those sit in the nine metropolitan markets where the underlying factors are directly comparable. That is the layer this article runs on, and it produced a result we did not expect when we started.
The budget is not what keeps you out of a good café suburb. Across those 614 suburbs, 223 score GO for a café — and 128 of them, well over half, sit at rent pressure 4 or below. The suburbs a thin budget can afford are, on our own numbers, disproportionately the good ones.
What $150,000 rations is not the postcode. It is the condition of the room you walk into.
The constraint is real, but it sits somewhere almost nobody looks. Two shopfronts on the same street, at the same rent, in the same suburb, can differ by $161,000, on the model below, in what it costs to open a café in them — because one was a café last month and the other has never had a grease trap. That number dwarfs every suburb-level rent difference in the country, and it is invisible on a listing.
This article does three things. It shows what our suburb layer actually says about rent and café viability, including the part of that finding that is definitional and should be discounted. It decomposes $150,000 into the stack of costs that consume it, using published Australian trade and government figures rather than our own guesses. And then it answers the question in the title with named suburbs, our scores for them, and the reasoning attached.
What this is not
This is not a recommendation to sign anything. A suburb score is a **base rate**, not a verdict on an address — a GO suburb contains sites that would fail and a CAUTION suburb contains sites that would thrive. We do not know your rent, your operator experience or your concept, and the financial model below is a labelled MODEL, not a forecast of your business. Nothing here is financial, legal or valuation advice. See our [methodology](/methodology).
What 614 suburbs say about cheap rent
Every suburb in the Locatalyze layer carries five factors scored 1–10: demand strength, rent pressure, competition density, seasonality risk and tourism dependency. A café score is computed from four of them on fixed weights — demand 40%, rent 28%, competition 18%, seasonality 14% — and 69 is the threshold at which the engine returns GO. None of those numbers are entered by hand; they fall out of the factors.
Group the 614 metropolitan suburbs into rent bands and the pattern runs one way, without a reversal. FACT: in the cheapest band, rent pressure 1–3, the mean café score is 70.1 and 73% of suburbs clear GO. In the dearest band, rent pressure 7–10, the mean café score is 62.9 and 9% clear GO. The gap is not marginal and it does not reverse anywhere in between.
The part of this that is circular, stated plainly
Rent pressure is 28% of the café score. So a cheap suburb scores higher **partly by definition**, and anyone quoting the left panel alone is quoting our own weighting back at themselves. The right panel is the honest test, because demand strength is a raw input rather than an output. Across the full rent range, mean demand rises from 6.0 to 8.0 — two points out of ten — while rent pressure rises by more than five. FACT: the correlation between rent pressure and demand strength across the 614 suburbs is r = 0.49, so expensive suburbs genuinely are busier. LOCATALYZE ANALYSIS: they are not two-and-a-half times busier, which is roughly what the rent asks you to believe.
That asymmetry is the whole argument, and it gets sharper once you notice what kind of number each side is. The extra demand in an expensive suburb is a probability — more people pass, so more of them might come in, at a conversion rate you will not know until you have traded for a year. The extra rent is a certainty. It is a fixed monthly liability that begins on handover and does not care how the first winter goes.
INFERENCE: an operator with deep reserves can underwrite a probabilistic gain with a fixed liability, because they can survive being wrong for eighteen months. An operator with $150,000 cannot. The same trade that is merely expensive for a third-site operator is structurally unsafe for a first-timer, which is why generic advice to “pay up for a good location” is worse than useless when it reaches the wrong reader.
Competition does not rescue the expensive end either. Mean competition density rises with rent as well — from 4.3 in the cheapest band to 5.7 in the dearest — so the busier footpath is also the more contested one. You are paying more for demand you then have to share with more people.
The same picture, city by city
Splitting by city shows how unevenly the opportunity is distributed, and this is the part a national average hides completely.
FACT: Perth has 36 suburbs that both clear GO for a café and sit at rent pressure 4 or below — more than Melbourne's 29 and nearly double Sydney's 19. Brisbane has seven, from a base of 117 suburbs, which is the weakest ratio of any large market in the layer. Hobart has eleven from sixteen, the highest share in the country, off a market small enough that eleven is close to all of it.
LOCATALYZE ANALYSIS: these are not statements about which city is nicer to live in. They are statements about how many workable, affordable café catchments a budget-constrained operator has to choose between. On that specific measure Perth is the deepest market in Australia and Brisbane is the shallowest, and neither of those is the conventional view. Our Perth café precinct analysis and Melbourne equivalent go street by street inside those two.
Australia's dearest café addresses, and what they score
Fourteen suburbs in the layer carry rent pressure of 8 or 9. They are the addresses that appear in every fantasy version of this decision: Sydney CBD, Melbourne CBD, Bondi Beach, Toorak, Double Bay, Manly, Brighton, Kirribilli, North Sydney, Southbank, Armadale, and the Perth, Adelaide and Brisbane CBDs.
FACT: not one of the fourteen reaches GO for a café. The best is North Sydney at 65, four points short. The worst is Armadale in Melbourne at 54. Every one of the fourteen returns CAUTION or RISKY.
Some of that is the rent weighting, and we have already said so. But the CBDs fail on a second axis entirely: Sydney CBD, Melbourne CBD, Brisbane CBD, Perth CBD, Adelaide CBD and Manly all carry competition density of 7 or 8 out of 10. The footpath is busy and the market is already served. Toorak, Brighton and Armadale fail differently again — competition is low, at 4 or 5, but demand is only 7 out of 10, because an affluent residential suburb is not the same thing as a high-frequency café catchment.
LOCATALYZE ANALYSIS: the prestige addresses fail for two unrelated reasons, and confusing them is expensive. A CBD site fails a thin budget because you are buying into an established competitive set at the top of the rent range. A wealthy residential strip fails because household income does not convert into daily coffee volume at anything like the rate operators assume. We looked at one of these in detail in would a café survive at 100 William Street, Perth.
Have a specific shopfront in mind rather than a suburb? A suburb score is a base rate. Locatalyze reads the actual frontage — demand, competitors, catchment and rent pressure at that address.
Free location score, map, data confidence and PROCEED / VERIFY / AVOID recommendation. Modelled financials stay optional.
Analyse an addressWhat $150,000 actually is
Now the other half. If the suburb is not the binding constraint, what is?
Start with what the number has to cover. A café budget is not a rent budget. It is a capital stack that has to reach handover — the day the doors open — and then have something left over, because almost no café is profitable in month one. Everything in that stack is spent before a single coffee is sold.
The largest line by a distance is the fit-out, and it is also the line nobody can quote you within a factor of three. FACT: Access Projects publishes a range of AUD 1,000–3,000 per square metre for a small-to-medium café. FACT: Petra Group's 2026 guide puts casual dining and urban cafés at AUD 2,500–4,000 per square metre, and a commercial kitchen alone at AUD 3,000–5,500. Those two published Australian ranges barely overlap.
The biggest number in your budget is the one the industry cannot quote within a factor of three. That is not sloppiness — it is the premises talking.
LOCATALYZE ANALYSIS: the spread is not noise and it is not vendors disagreeing. It is the condition of the premises expressing itself as a price. At the bottom of the band you are refreshing a room that already works as a food business. At the top you are building the food business into a room that has never been one — and that room needs an exhaust through the roof, a grease trap in the slab, three-phase power, trade waste, an accessible toilet and a fresh development approval.
FACT: Petra Group prices HVAC and ventilation at AUD 15,000–45,000 and grease traps at AUD 10,000–25,000, puts council development and building applications at AUD 5,000–15,000 and health certification and food business licences at AUD 1,500–3,000, and recommends a 15% cash buffer on top.
So we modelled the same $150,000 three times — same 55 square metres, same $1,200 a week gross rent, same everything except the state of the room.
MODEL. The two fit-out rates that drive the result sit at the lower bound of a published band — $2,500/m² is the floor of Petra Group's casual-dining range, $1,500/m² the floor of Access Projects' Sydney and Melbourne rates. The remaining lines are our own assumptions, held constant across all three columns so that only the premises condition moves. The finding does not depend on them being generous. Re-run the cold shell with every published figure at its true floor — $1,000/m² fit-out, $15,000 HVAC, $10,000 grease trap, $5,000 council application — and it still reaches handover at about $256,000. The result still holds: at $150,000 a cold shell is not a tight option, it is arithmetically out of reach, and it fails before you have bought a coffee machine. A fitted shell consumes the entire budget and finishes short. Only taking over premises that already trade as a café leaves anything behind.
The bond is not the only money you cannot touch
FACT: the NSW Small Business Commissioner states that lease security may be a cash bond, a bank guarantee or a third-party guarantee, that the amount is negotiable and commonly set as a number of months' rent, and that a tenant **usually has to give the bank some form of security to obtain a bank guarantee**. LOCATALYZE ANALYSIS: a bank guarantee is not a way to keep your cash. Your bank will generally want a term deposit behind it, so the money is locked either way — and unlike a cash bond, the landlord can call on a bank guarantee without telling you first.
The number that needs no forecast
Here is the problem with almost every café feasibility model, including the ones we have written. They all start with a revenue guess. Customers per day, times average ticket, times thirty. Change the first number by 15% and the answer changes from viable to catastrophic, and nobody knows the first number before they trade.
There is one measure of a start-up budget that requires no revenue forecast at all, because it is pure division. Take what is left after handover and divide it by the monthly rent. That gives you months of rent in the bank — how long your remaining capital could pay rent alone, before wages, before stock, before power, before you.
It is not a survival forecast; the real runway is shorter, because rent is never the only bill. It is a ceiling. And a ceiling you cannot manipulate is more useful than a projection you can.
On the model above, taking over a trading café at $1,200 a week leaves $35,025 against $5,200 a month of rent: 6.7 months of rent in the bank. The fitted shell and the cold shell leave none, because they never reach handover.
Labelled model
What your budget actually buys
Move the budget and change the premises. The rates are named underneath, with their published sources where those exist. The output is the one number in this space that needs no revenue forecast: months of rent left in the bank on the day you open.
- Cost to reach handover$114,975
- Left after handover$35,025
- Months of rent in the bank6.7
6.7 months of rent in the bank. You open with $35,025 left against $5,200 a month of rent. That is enough runway to trade through a slow first winter and to fix the things a fit-out gets wrong, which is what a buffer is actually for.
MODEL. The cold-shell fit-out rate is the floor of Petra Group’s 2026 casual dining and urban café band (AUD 2,500–4,000/m²) and the fitted-shell rate the floor of Access Projects’ Sydney and Melbourne rates; Access Projects quotes AUD 1,000–3,000/m² for a small-to-medium café. Services and approvals sit inside Petra Group’s 2026 ranges rather than at their floors, and equipment, stock and the three-month bond are this model’s assumptions — held constant across all three columns, so only the premises condition moves the answer. The 15% contingency is Petra Group’s recommendation, and the bond follows the NSW Small Business Commissioner’s note that lease security is negotiable and commonly set as a number of months’ rent. Rent is treated as gross. Nothing here forecasts trade, and this is not a Locatalyze report — a report reads one specific address.
Move the budget, the floor area, the rent and the condition of the premises, and watch which variable actually moves the answer. Floor area and premises condition dominate. Rent matters far less than operators expect at this stage, because three months of it is a bond and the rest has not been paid yet.
LOCATALYZE ANALYSIS: this is the inversion. Before you open, rent is a small share of what your capital does — the bond is typically 10–15% of a thin stack. After you open, rent becomes the fixed cost that decides whether you survive. Which means the rent decision has to be underwritten against the trading years, while the premises decision has to be underwritten against the budget. Most first-timers do the reverse: they agonise over $200 a week of rent and accept a shell that costs them $80,000.
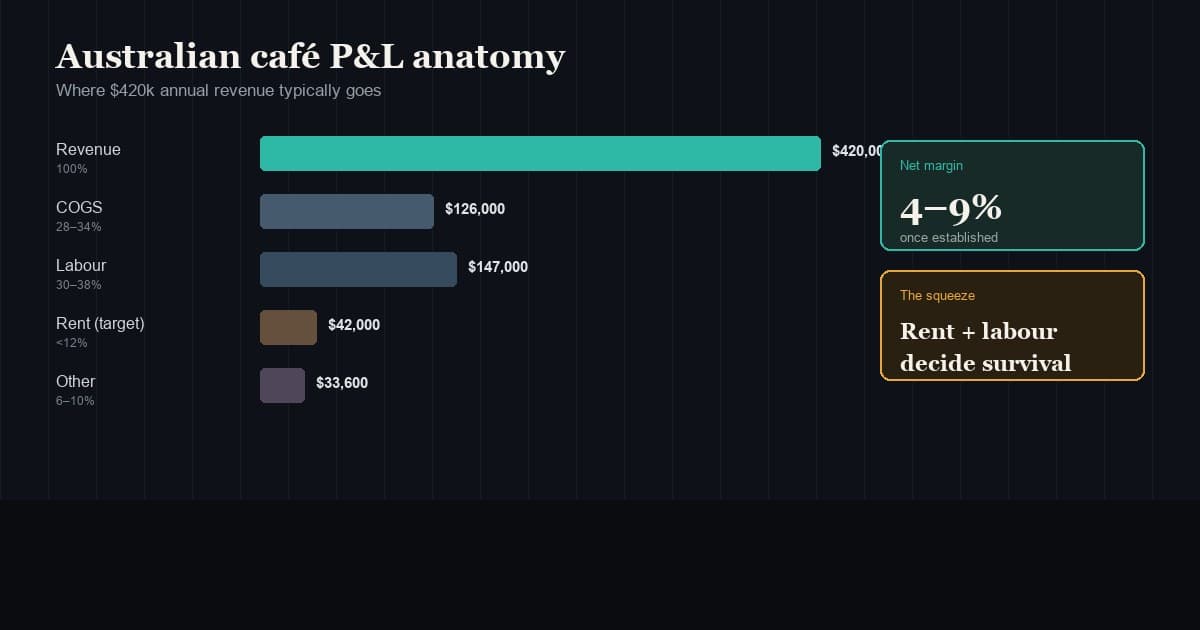
For the trading-years half of that, the ATO publishes the only official Australian anchor. FACT: for the 2023–24 year, coffee shops reported rent at 10–17% of turnover in the $65,000–$250,000 band, 8–14% at $250,001–$600,000, and 6–10% above $600,000. FACT: average total expenses were 79%, 86% and 89% of turnover across those same three bands. We work through what that implies for a P&L in coffee shop profitability in Australia and how to test a specific asking rent in commercial rent affordability.
One line in the ATO benchmarks worth reading twice
FACT: the ATO states that these coffee shop benchmarks **do not apply to coffee carts, vans or other mobile coffee retailers**. LOCATALYZE ANALYSIS: the single most common piece of $150,000 advice — buy a cart — does not point at a cheaper café. It points at a different business, with a different cost structure, different demand and no lease. That may well be the right answer for some readers. It is not a budget version of the thing they were asking about, and it should not be offered as one.
So where would we open?
With $150,000, we would take over a trading café. That decision comes first and it eliminates most of the market, because it means we are not shopping for a suburb — we are shopping for the handful of sites in a suburb that already have a working kitchen behind them.
Given that, here is where we would look, and why. These are suburb-level base rates from our own layer, not endorsements of any particular shopfront.
The answer the data gives first: Fitzroy, Melbourne
FACT: Fitzroy is the highest-scoring café suburb in the layer at 87, on demand strength of 10, competition density of 3 and rent pressure of 4 — which puts the best café catchment in the country inside the affordable half of the rent range. On the argument this article has just made, that is the answer, and it would be dishonest to leave it out because it is inconvenient.
LOCATALYZE ANALYSIS: two things make it a hard answer for this specific budget. Rent pressure is a suburb-level ordinal, and Fitzroy's covers everything from a Brunswick Street frontage to a side street off Johnston — a range wide enough that the suburb figure tells you almost nothing about what the good frontages cost. And a suburb that everyone already knows is good has no cheap fitted sites sitting idle; the ones that come up go quickly and at a price that reflects it. INFERENCE: with $150,000 you can look in Fitzroy, but you should expect to be outbid on the tenancies that would actually suit you, which is a different problem from the one the rest of this article solves. The suburbs below are where the same trade is available with less competition for the site itself.
If the priority is demand you do not have to create: Preston, Melbourne
FACT: café score 78, rent pressure 3, demand strength 8, competition density 4. Preston sits in our cheapest rent band while carrying demand of 8 out of 10 — a combination exactly four suburbs in the 614 manage. Preston and Footscray share the lowest competition of the four at 4 out of 10; the other two, Cabramatta and Box Hill, both sit at 6. Footscray scores identically to Preston on all four factors.
LOCATALYZE ANALYSIS: this is the best raw trade in the layer. You are getting inner-north Melbourne demand at outer-suburban rent pressure, with competition low enough that a competent operator is not fighting for scraps. The catch is that Melbourne is the most contested café market in Australia and the sites that already trade get bought quickly, which means the constraint here is deal flow rather than money. Our Melbourne café suburb ranking and the companion piece on Melbourne suburbs where cafés fail sit either side of this.
If the priority is depth of choice: Mount Lawley, Perth — and Perth generally
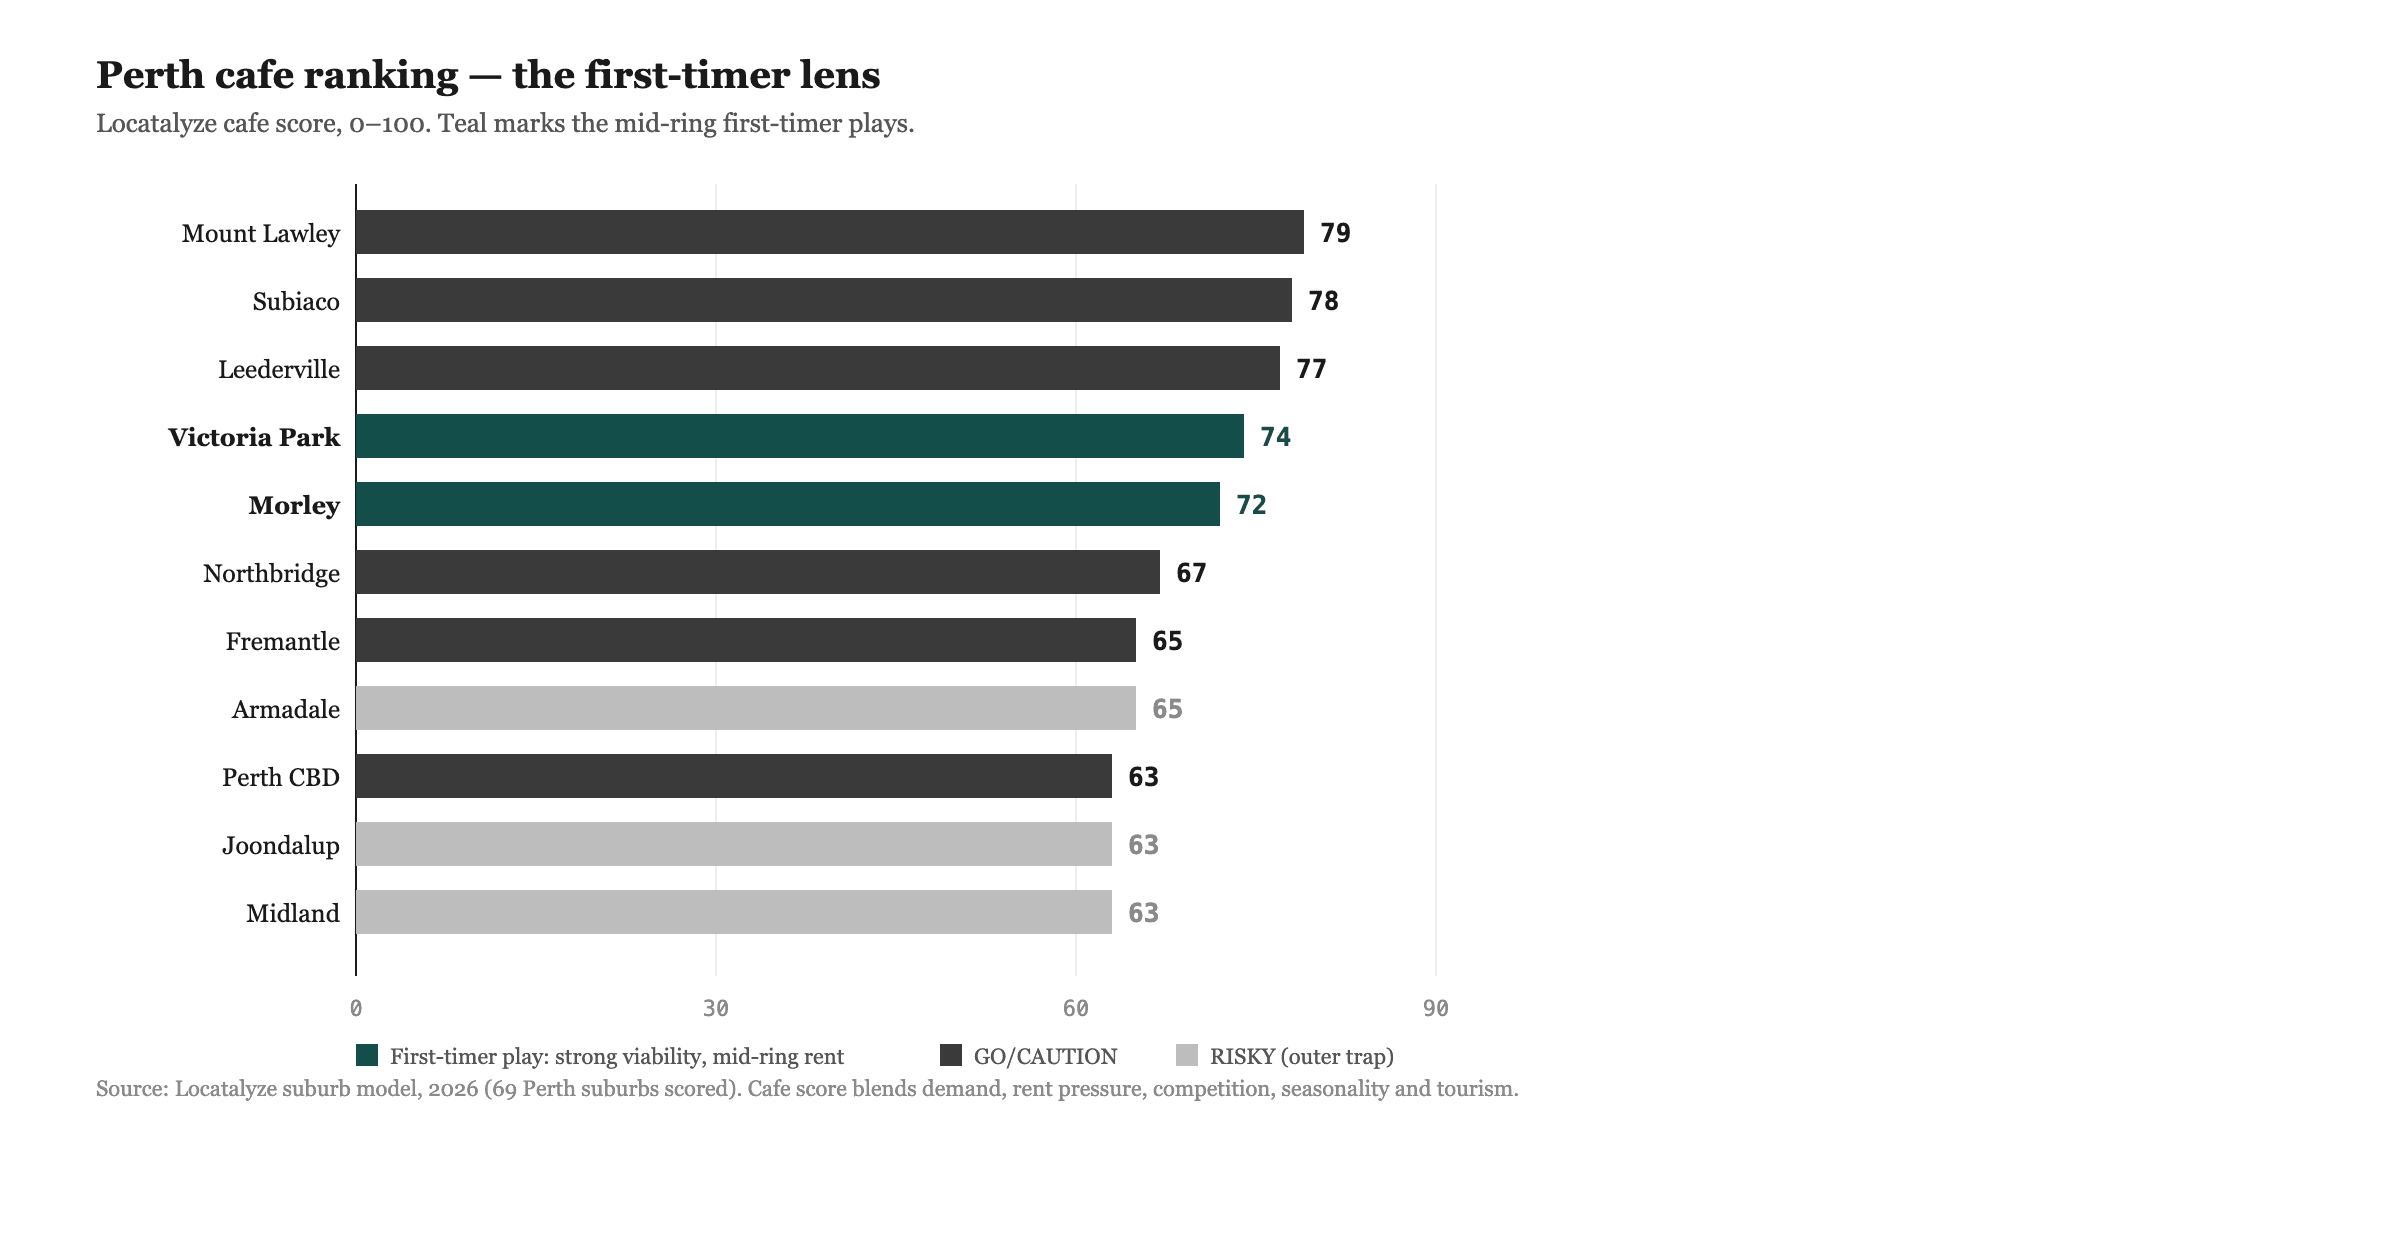
FACT: Mount Lawley scores 79 for a café, on rent pressure 4, demand 8 and competition 3 — one of only three suburbs scoring above 75 that carry a competition density of 3, alongside Fitzroy and Pakenham. FACT: Perth has 36 suburbs clearing GO at rent pressure 4 or below, the most of any Australian city in our layer. Leederville scores 77, Como 76, Victoria Park 74.
LOCATALYZE ANALYSIS: for a budget operator, depth of choice is worth more than a single top score, because it means you can wait for the right fitted site instead of taking the one that is available. A market with 36 workable catchments lets you say no. A market with seven does not. This is the answer we would give someone who has $150,000, no site yet, and the ability to move cities. Best Perth suburbs for a first-time café owner goes further into the first-timer filter.
If the budget is really $120,000: West Hobart
FACT: West Hobart scores 75 for a café at rent pressure 4, demand 7, competition 3 and seasonality 2. FACT: eleven of Hobart's sixteen scored suburbs clear GO at rent pressure 4 or below — 69%, the highest share of any city in the layer.
LOCATALYZE ANALYSIS: Hobart's advantage is that low rent pressure and low competition arrive together, and its seasonality risk of 2 means the winter is a demand question rather than a survival question. The honest limit is scale: a smaller catchment caps the upside, so this is a strong answer for an owner-operator café and a poor one for anyone modelling a second site. INFERENCE: on a $120,000 stack, where the working-capital buffer is the thing most at risk, a market where both rent and competition are low is worth more than a market where only one of them is.
Every suburb above is a live page on this site with the full factor breakdown behind it — for example Mount Lawley, Preston, Leederville and West Hobart.
Where we would not open
The fourteen dearest suburbs are the obvious exclusion and we have already made that case. Two less obvious ones matter more.
The first is Brisbane on this specific budget. FACT: seven of Brisbane's 117 scored suburbs clear GO at rent pressure 4 or below — 6%, against Melbourne's 28% and Perth's 21%. LOCATALYZE ANALYSIS: Brisbane is not a bad café market; it has 33 GO suburbs in total. It is a bad cheap café market, because its affordable suburbs and its strong-demand suburbs are largely different suburbs. A $150,000 operator in Brisbane is choosing between good sites they cannot fund and fundable sites with thin demand, which is a harder problem than the same operator faces in Perth.
The second is any site where the rent looks like the bargain. INFERENCE: a shopfront materially cheaper than its neighbours on the same strip is usually cheaper for a reason the listing will not state — a dead corner, no services, a make-good obligation, a short remaining term, or a previous food tenant who left because the block does not work. On a thin budget the cheap-rent trap is worse than the expensive-rent trap, because the money you save on rent is trivial next to the money you spend making an unfit room fit. We wrote that argument out in full in why a cheaper lease can be the more expensive location.
What we would do next week
Ten checks before a $150,000 café commitment
Roughly two weekends and one working day
The eighth and ninth of those are the ones people skip. How much foot traffic a café actually needs gives the arithmetic for the count, and the pre-lease checklist for Australian restaurants and cafés covers the clauses that change the dollars once you are past site selection.
Method, evidence and limits
The suburb figures are our own calculation over the Locatalyze suburb layer as it stood in September 2026. That layer covers 1,111 suburbs nationally; this article uses the 614 in nine metropolitan markets — Sydney, Melbourne, Perth, Brisbane, Adelaide, Hobart, Canberra, Darwin and Geelong — where all five factors are recorded on the same basis and are therefore comparable. Regional cities were excluded rather than blended, because their factors are calibrated against different reference markets.
Each suburb carries five factors scored 1–10. The café score is a weighted composite of four of them — demand strength 40%, rent pressure 28% (inverted), competition density 18% (inverted), seasonality risk 14% (inverted) — computed deterministically by the scoring engine. GO is a composite of 69 or above. No score in the layer is hand-entered; a guard in the codebase rejects manual scores.
Rent pressure is an ordinal 1–10 assessment of how expensive and how competitive the leasing market is for that suburb. It is not a dollar figure and this article does not convert it into one. Where you need dollars, our commercial rent per square metre reference sets out the small number of Australian rent benchmarks that are actually published, and is explicit about the gaps.
What this cannot tell you: whether any specific address is viable. A suburb score is a base rate over a catchment, and the variance inside a suburb is larger than the variance between suburbs — one end of a strip can be a different business to the other. It also cannot tell you what any operator is trading, because that is private, and we do not estimate it.
The cost model is a MODEL, labelled as such wherever it appears. It uses the lower bound of published third-party ranges throughout, holds floor area and rent constant so that only the premises condition varies, and makes no revenue assumption of any kind. It is a description of what a budget has to cover, not a projection of a business. Your quotes will differ, which is the point of getting them.
Every figure in this article was checked on 7 September 2026.
Sources
Locatalyze is decision-support for location choice. Nothing in this article is financial, legal, valuation or investment advice, and no business, agent or supplier named here is a customer, partner or sponsor. Trade-source cost ranges are those firms' published figures, not ours, and are reproduced so a reader can check them. Last checked 7 September 2026.
Test the shopfront, not the suburb
A suburb score narrows a shortlist. Locatalyze reads one specific Australian address for demand, competition, catchment and rent pressure, and shows the evidence behind every number.
Analyse a café location freeFrequently asked questions
About the author
Locatalyze Research Team
Location intelligence, Locatalyze
The Locatalyze research team builds the location-scoring models behind the platform and writes up what the evidence shows for Australian operators.
Tools first — then a full report for your address
Free rent, viability, and break-even checks. Upgrade when you are ready for competitors, map, and numbers for a specific site.
No signup required for tools