Where do cafes fail in Melbourne? Not, for the most part, in the suburbs that look obviously hard. They fail in the suburbs that look obviously easy. A street of renovated terraces, a tram stop, a deli, a wine bar, three cafes already trading and a fourth tenancy going up for lease at a number that feels achievable until the third quarter. That picture reads as a green light to a first-time operator. On the Locatalyze suburb model it frequently reads as a commercial trap, and most of those traps sit within two kilometres of a suburb where the same format would have a fighting chance.
This is risk intelligence, not a hit piece. No suburb named here is a bad place to live, visit, or buy property, and several are among the most desirable addresses in the country. The question is narrower and more technical: for a *new, independent cafe* carrying a full occupancy cost and no established trade, which Melbourne suburbs carry the structural conditions that most often turn a viable concept into an eighteen-month loss? Across 60 Melbourne suburbs scored by the Locatalyze model, the verdict mix is 16 GO, 36 CAUTION and 8 RISKY (Locatalyze suburb model, 2026). Most of Melbourne is a CAUTION — a market you can win in with the right format and the right number. The suburbs below are the worst of the read, and they fail for three distinct reasons that have nothing to do with how nice the strip looks at 9am on a Saturday.
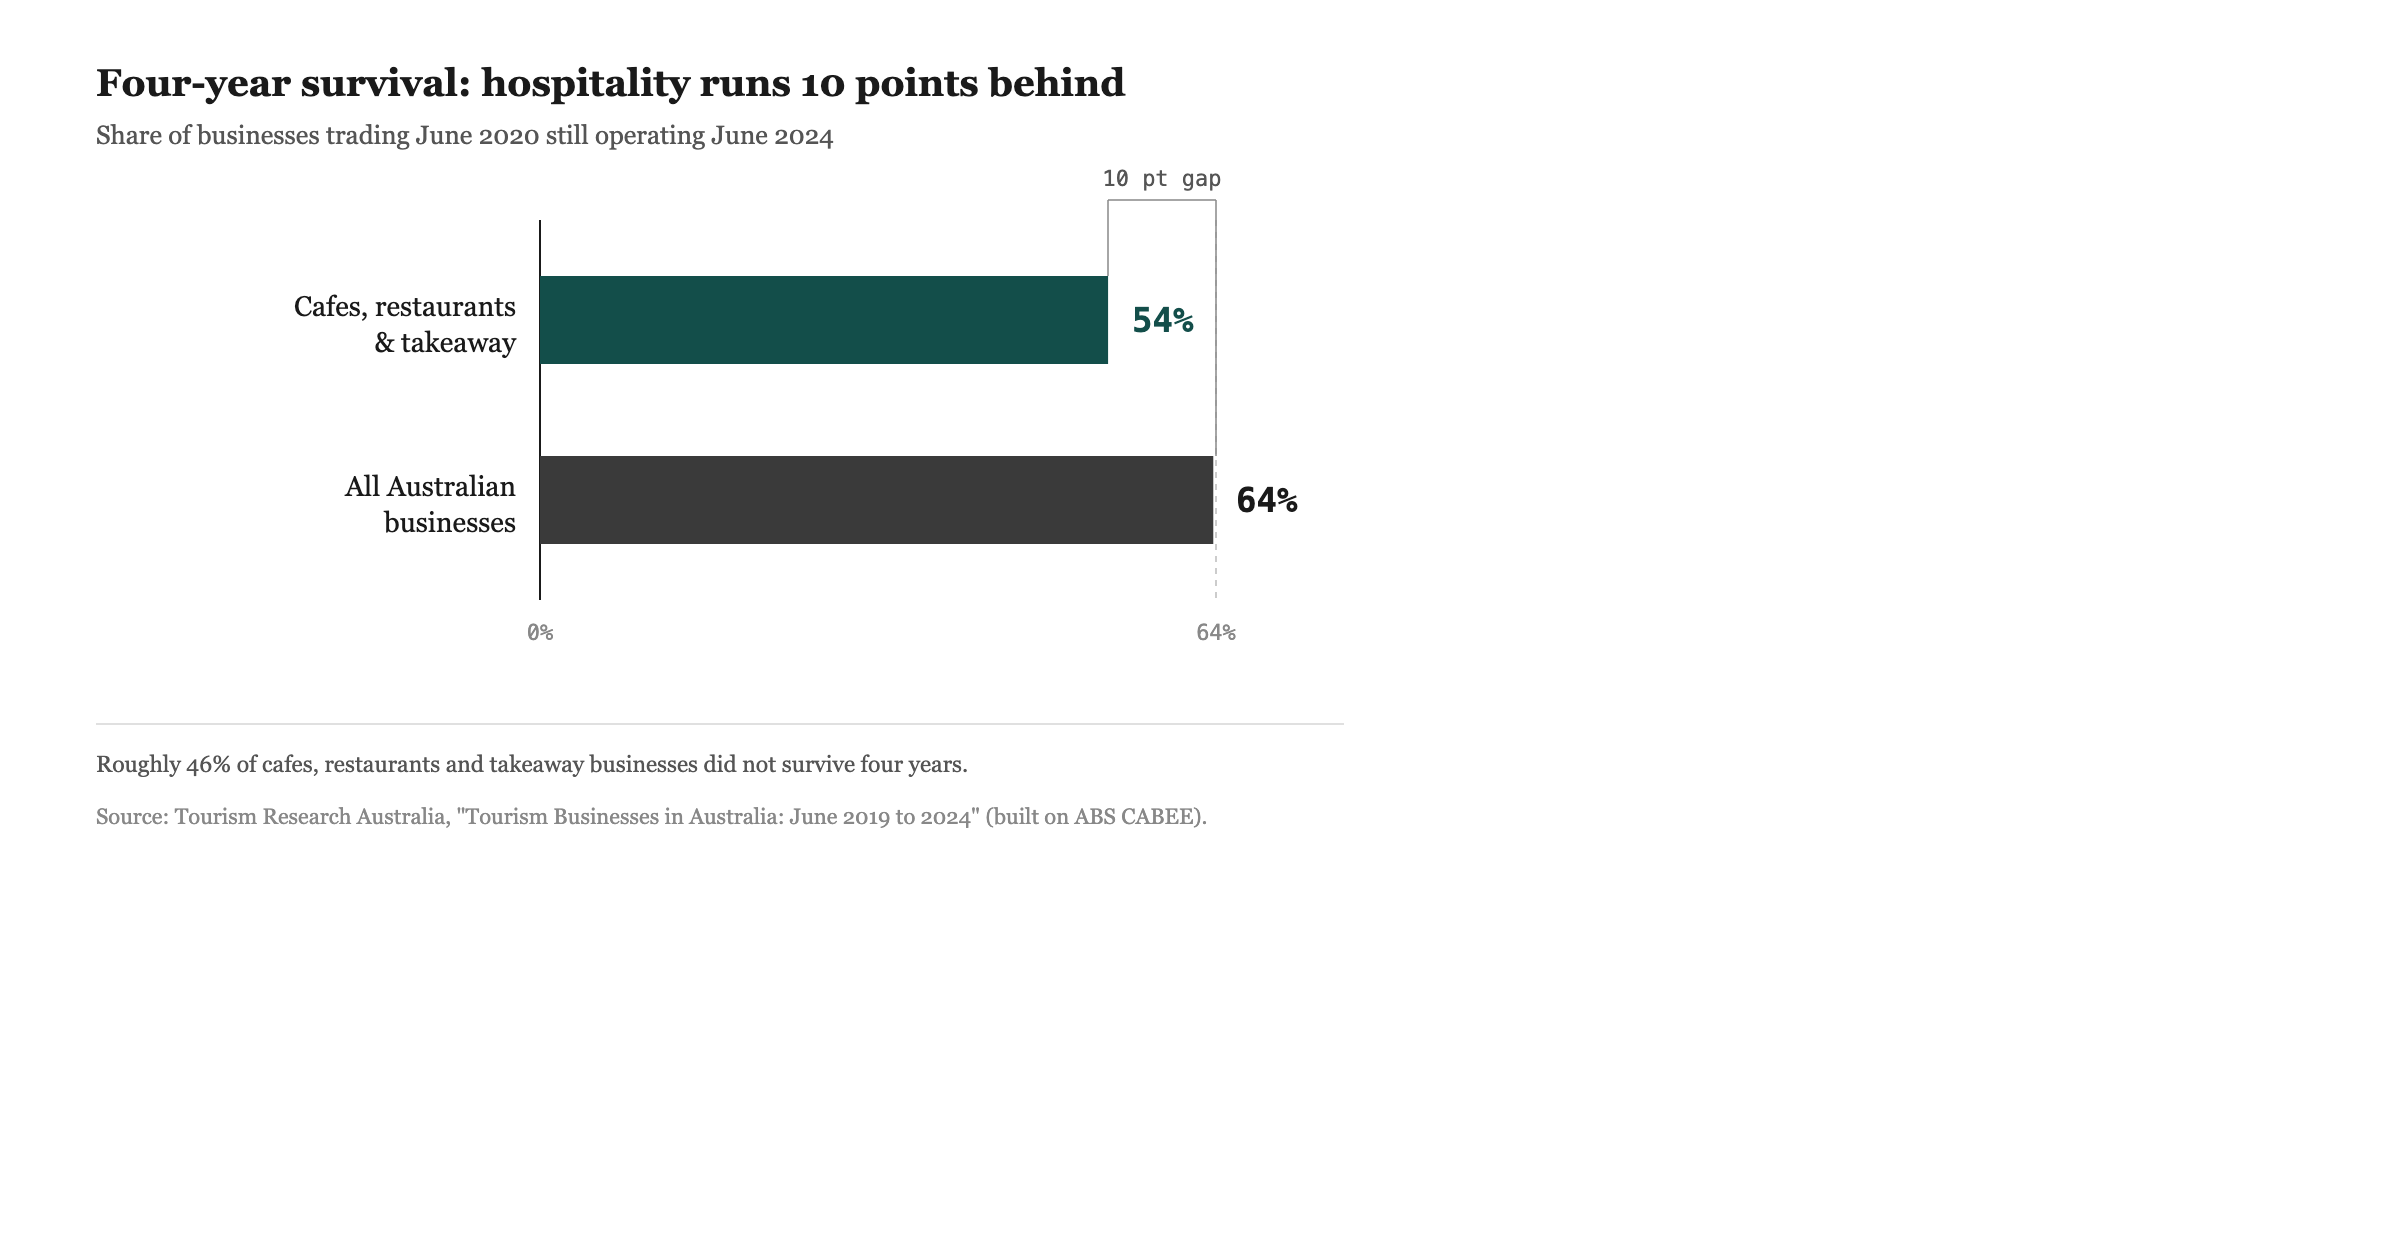
The base rate is what makes the location call non-recoverable. Of every 100 cafes, restaurants and takeaway businesses trading in mid-2020, only 54 were still trading four years later, against 64 across the whole economy (Tourism Research Australia, on ABS Counts of Australian Businesses data). Accommodation and Food Services was the second-largest source of corporate insolvency in Australia in FY2023–24, around 15% of all external administrations, roughly 1,667 companies, despite being a small share of the business base (ASIC insolvency statistics, FY2023–24). A wrong-suburb cafe does not give you a slow, fixable margin problem. It gives you the accelerated version of those numbers, because the rent is fixed on day one and the trade has to be earned over years you may not get.

Scatter chart of where cafes fail in Melbourne, plotting rent pressure against Locatalyze cafe score for eleven flagged suburbs, with Armadale, Toorak and Brighton clustered in the high-rent, low-viability corner and Sunbury and Coburg sitting left on a separate failure path
Where do cafes fail in Melbourne: what the data means, and what it does not
A precise claim needs a precise definition, because the loose version of this topic invites defamation and bad decisions in equal measure. "Fail most often" in this piece means one specific thing: a sustained CAUTION or RISKY verdict from the Locatalyze suburb model, driven by adverse rent-pressure, competition or demand factors, that materially lowers the probability a new independent cafe reaches durable profitability at that address. It is a forward-looking risk read on the suburb as a trading environment.
It is not a closure census. This piece does not count how many cafes shut in any postcode, because that data is not publicly available at street or suburb granularity in a form anyone can verify. The ABS reports business exits at the industry and broad-region level — the national exit rate across all businesses was 13.9% in 2024–25 (ABS Counts of Australian Businesses) — but it does not publish a leaderboard of which Melbourne streets churn their hospitality tenants. Anyone who tells you "four cafes turned over on this stretch last year" is almost always reciting anecdote, not audited data. So this analysis stays at the level where the evidence is real: suburb-level market structure. No individual business is named, assessed, or blamed anywhere in this piece, and none should be inferred. A suburb can be a high-risk cafe environment while containing excellent, profitable cafes that got their format, timing and lease right.
With that boundary set, the model flags three failure archetypes.
Archetype one: the prestige rent trap
The first and cleanest pattern is prestige misread as viability. These are wealthy, beautiful, high-status suburbs where the rent has fully capitalised the desirability of the address, and a cafe — a low-margin, high-labour, footfall-dependent format — cannot carry that occupancy cost on the trade the catchment actually delivers.
Three suburbs anchor the pattern. Armadale scores a cafe 54 with a RISKY verdict, on a rent-pressure factor of 9 against a demand factor of 7. Toorak scores cafe 59, RISKY, rent pressure 9, demand 7. Brighton scores cafe 60, RISKY, rent pressure 8, demand 7 (Locatalyze suburb model, 2026). The shape is identical in all three: demand is genuinely good, a 7 out of 10, the kind of number that would support a cafe comfortably in a cheaper suburb. But the rent-pressure factor is at the top of the scale, and in the Locatalyze model rent pressure is the single strongest driver of the cafe score across Melbourne, correlating −0.58 with it — stronger than demand's +0.49 and far stronger than tourism's +0.18 (Locatalyze suburb model, 2026). The occupancy cost simply eats the margin.
The trap is psychological as much as financial. A high-net-worth catchment feels like the safest possible customer base. The error is treating average household wealth as average cafe spend. Prestige residents do not drink four flat whites a day because they can afford to; cafe revenue is a function of transaction volume and frequency, not of how much money sits behind the postcode. Meanwhile the landlord prices the tenancy off the suburb's status and its retail comparables, not off what a cafe's unit economics can bear. The result is a high fixed cost meeting an ordinary, residentially-paced demand curve. The daypart problem compounds it: prestige residential streets are thin outside the weekend brunch peak, so the operator pays a premium rent for a tenancy that only truly works two mornings in seven.
Brighton adds a seasonal wrinkle — a seasonality factor of 4, higher than its neighbours — because a bayside catchment that swells in summer and empties in winter forces you to size staff and stock for a peak you cannot bank on year-round. The general principle holds across all three: in a prestige suburb, the rent is the most aggressive competitor you will face, and it never closes.
Archetype two: the oversaturated strip
The second pattern is saturation. These are the suburbs that look like cafe country precisely because they already are — established hospitality strips where the format is proven, the culture is set, and exactly because of that, the competition factor is high and the marginal new entrant inherits a fully-served market.
Four suburbs carry this read. Thornbury scores cafe 60, RISKY, on a competition factor of 7. Abbotsford scores cafe 59, RISKY, competition 6. Coburg scores cafe 61, RISKY, competition 6. Doncaster scores cafe 62, CAUTION, competition 7 (Locatalyze suburb model, 2026). In each case demand is real — these are not dead suburbs — but the demand is already absorbed. Saturation is not about how many people walk past; it is about how thinly the existing spend is already sliced before you open. A new cafe on a mature strip is not capturing demand, it is trying to take share from incumbents who have the lease history, the regulars, the staff and the supplier terms you do not.
This is where footfall is most actively misleading. A busy strip reads as opportunity to the eye and as risk to the model, because the same volume that fills the footpath is the volume the incumbents already monetise. We have written separately on why high foot traffic routinely produces low sales — pass-through movement, wrong daypart, and demand that is already captured upstream are the usual culprits — and the oversaturated strip is that failure mode at suburb scale. The trade looks abundant. Your *share* of it, as the newest operator with the least catchment loyalty, is the number that decides whether you survive, and on a saturated strip that share starts low and is expensive to grow.
Doncaster earns a marginally softer CAUTION rather than RISKY, but for an instructive reason: part of its competition is mall-anchored, which both concentrates and walls off the trade. That structural point becomes its own archetype below.
Archetype three: the demand and structure mismatch
The third pattern is the broadest and the least intuitive: suburbs where the raw demand or the physical structure of the catchment does not match what a cafe needs, even when the rent is moderate and the strip is not crowded.
Four suburbs illustrate the range. Essendon scores cafe 60, RISKY — a solid, established suburb where the combination of moderate demand and middling rent never resolves into a clear cafe edge. Sunbury scores cafe 64, CAUTION, on a demand factor of just 4, the lowest in this group: a growth-corridor suburb where the organic, walk-up cafe demand simply is not deep enough yet to support density, regardless of how cheap the tenancy is. Chadstone scores cafe 64, CAUTION, with a competition factor of 7, but its dynamic is mall-dominated — trade is captured inside a centre that controls access, rent and tenant mix, so a street-front cafe competes against a managed retail machine rather than an open catchment. Docklands scores cafe 62, CAUTION, with a demand factor of 7 that flatters the reality: as a planned precinct, it suffers a one-way-flow problem, where commuters and residents move *through* on fixed paths rather than dwelling, so apparent demand does not convert into the lingering, repeat trade a cafe lives on (Locatalyze suburb model, 2026).
The unifying lesson is that a moderate rent does not rescue a structural demand problem. Sunbury's cheap lease cannot manufacture catchment depth. Docklands' resident headcount cannot fix a precinct designed for movement rather than dwell time. Chadstone's traffic cannot help a street operator locked out of the mall's controlled trade. These are the hardest failures to foresee, because none of them show up as an obviously bad rent or an obviously empty street. They show up only when you model the catchment's *structure* against what a cafe actually requires: residential density, repeat-visit behaviour, the right daypart spread, and an open rather than enclosed trade.
The ten, at a glance
The table below collects the flagged suburbs with the factor that drives the risk. Read the verdict and the lead factor together — the verdict is the model's overall call, and the lead factor tells you which of the three archetypes you are looking at.
Eleven suburbs appear because the model flags eleven worth a first-time operator's caution; the seven RISKY-verdict suburbs are the genuine red lights, and the CAUTION cases are amber for the specific structural reason noted (Locatalyze suburb model, 2026). None of these is uniformly doomed. Each can work for a specific format with a specific cost base. But each carries a structural headwind that the surface read of the suburb actively hides.
The comparison that matters: Thornbury versus Northcote
The most useful way to understand suburb-level risk is to put a flagged suburb next to a nearby one that looks almost identical and scores completely differently. The cleanest pair in Melbourne runs down the same corridor: Thornbury and Northcote.
They sit roughly two kilometres apart on the same northern tram line, share a built form, a demographic profile and a hospitality culture, and to a casual eye offer the same opportunity. The model disagrees sharply. Thornbury scores cafe 60 with a RISKY verdict; Northcote scores cafe 75 with a GO verdict (Locatalyze suburb model, 2026). Fifteen points and two verdict tiers separate two suburbs you could walk between in twenty-five minutes.
The difference is saturation and demand depth, not postcode. Northcote carries a demand factor of 8 against Thornbury's 7, and — more decisively — a competition factor of 5 against Thornbury's 7 (Locatalyze suburb model, 2026). Northcote has both deeper underlying demand and meaningfully more room inside it; Thornbury has slightly thinner demand being contested by more incumbents. Same corridor, same look, opposite trading reality. The lesson is that "near a good cafe suburb" is not the same as "a good cafe suburb." Two kilometres on the right side of a saturation line is the difference between a GO and a RISKY, and you cannot see that line from the street.

Paired comparison panels: Thornbury (RISKY, cafe score 60) against Northcote (GO, cafe score 75) on the same tram corridor, and Toorak (RISKY, cafe 59, rent pressure 9) against neighbouring South Yarra (GO, cafe 75, demand 10), showing how nearby suburbs diverge on the factors
The same logic separates the prestige pair. Toorak scores cafe 59, RISKY; neighbouring South Yarra scores cafe 75, GO (Locatalyze suburb model, 2026). Both are wealthy south-eastern suburbs a short distance apart, but South Yarra carries a demand factor of 10 against Toorak's 7 and a slightly lower rent-pressure factor of 7 against Toorak's 9. South Yarra has genuine, dense, all-week trade — a true high-demand catchment — that can absorb a premium rent; Toorak has prestige and a top-of-scale rent meeting ordinary residential demand. Adjacency to a winning suburb confers nothing. The factors do.
How the Locatalyze model flags the risk
The methodology is deliberately narrow, because a forward risk read is only useful if you know exactly what it weighs. Each suburb is scored on five factors on a 1–10 scale: demand, rent pressure, competition, seasonality and tourism. These combine into a cafe-specific score on a 0–100 scale, and the score maps to a verdict band — GO, CAUTION, or RISKY — that expresses the model's overall read of the suburb as a trading environment for a new independent cafe.
The weighting is not symmetric, and that asymmetry is the whole insight. Rent pressure is the dominant driver, correlating −0.58 with the cafe score across all 60 Melbourne suburbs — the strongest single relationship in the model. Demand pulls the other way at +0.49, competition at −0.30, seasonality at −0.38, and tourism is nearly irrelevant at +0.18 (Locatalyze suburb model, 2026). Read those numbers together and the model's stance is clear: a suburb is flagged when a high occupancy cost, a saturated competitive field, or a shallow or badly-structured demand base undermines the unit economics — and rent pressure does the most damage of any single factor. Tourism, the thing operators most often chase, barely moves the result. A suburb scores well when demand is real and rent has not yet caught up to it; a suburb is flagged when one of the three structural problems is acute enough to make the format's economics unreliable.
That is why the flagged list cuts across superficially opposite suburbs. Armadale and Sunbury could not be less alike — one is top-decile wealth, the other an outer growth corridor — yet both are flagged, because the model is not scoring affluence or footfall. It is scoring the gap between what a cafe costs to run at that address and what the catchment will reliably return. The full live read for every Melbourne suburb, refreshed as the data moves, sits on the Melbourne suburb coverage page, and the inverse of this list — the suburbs where the ratio works — is laid out in the companion piece on the best suburbs to open a cafe in Melbourne. Read the two together; the best/worst pair is the same model pointed in opposite directions.
Limitations of this read
Three limits matter, and stating them plainly is part of the analysis.
First, this is a forward risk read, not a closure-rate audit. The model estimates the probability that a suburb's structure works against a new cafe; it does not, and cannot, report how many cafes actually closed there. Closure data by postcode is not publicly granular in Australia — the ABS publishes exits at industry and broad-region level, not by street or suburb — so any suburb-by-suburb "failure rate" you see quoted is an estimate or an anecdote dressed as a count. We deliberately do not provide one. The broader base rates we cite — the 54% four-year hospitality survival figure, the FY2023–24 insolvency share, the 13.9% national exit rate — are industry- and economy-wide, and we have written at length on what they do and do not tell you in the piece on Australia's cafe failure rate.
Second, the factors are scored at suburb level, which is the right altitude for market characterisation and the wrong altitude for a final decision. Within any flagged suburb there are corners, corners within corners, and individual tenancies where the local picture inverts the suburb read entirely — a side street with no competitors in a saturated suburb, or a sub-market rent in a prestige one. Rent pressure in particular varies enormously inside a single suburb; the suburb-level factor is a central tendency, not a quote for the tenancy you are actually considering. Occupancy cost is decided at the lease, not at the postcode.
Third, the model is a point-in-time read. Saturation eases when incumbents close; demand deepens as a corridor matures; a precinct's flow problem can be re-engineered. A suburb flagged today can shift bands as its factors move, which is why the dates on the live coverage matter and why a one-off snapshot should never be treated as a permanent verdict.
What to do with this
The practical conclusion is not "avoid these suburbs." It is "do not let the surface read of any suburb stand in for the structural read." Prestige is not viability. A busy strip is not an available market. Adjacency to a winning suburb confers nothing. The three things that actually decide whether a new cafe survives — occupancy cost against catchment depth, your realistic share of an already-served market, and whether the catchment's structure suits repeat cafe trade — are exactly the things you cannot see by standing on the footpath at peak hour.
So the only sound next step is to read your specific address against those factors before you sign anything, not the suburb in the abstract and certainly not the suburb's reputation. A two-kilometre move changed Thornbury into Northcote and Toorak into South Yarra; the equivalent move for your concept might be a different strip, a different daypart, or a different format entirely. You can run any Melbourne address through the same five-factor read the model uses on the analysis page, and the cost of doing it is a rounding error against the cost of being wrong, which the insolvency statistics price in years, not months.
If you are weighing a tenancy now, start with the exact address rather than the suburb — the lease is signed on a building, the rent is fixed on day one, and the suburb's average tells you almost nothing about the number you will actually carry.
Analyse your address →The suburbs on this list are not where good cafes are impossible. They are where the market has set a trap that the eye reads as an invitation, and the difference between the two is a model, a methodology, and the discipline to check the structure before the story.
*Commercial leasing benchmarks referenced in this analysis draw on published market data including the City of Melbourne's economic profile and our own survey of commercial rent per square metre across Australia.*
References
Australian Securities and Investments Commission, *Insolvency statistics, FY2023–24*: Accommodation and Food Services was the second-largest source of corporate insolvency, around 15% of all external administrations (roughly 1,667 companies), behind Construction. asic.gov.au
Tourism Research Australia, *Tourism Businesses in Australia: June 2019 to 2024* (built on ABS Counts of Australian Businesses): 54% of cafes, restaurants and takeaway businesses operating in June 2020 were still operating in June 2024, against 64% for all Australian businesses. tra.gov.au
Australian Bureau of Statistics, *Counts of Australian Businesses, Including Entries and Exits*: all-business exit rate of 13.9% in 2024–25; exits are published at industry and broad-region level, not by suburb. abs.gov.au
City of Melbourne, economic and commercial market profile: occupancy and leasing benchmark context for the inner-Melbourne suburbs assessed. melbourne.vic.gov.au
Locatalyze suburb model, 2026: cafe scores, verdicts and the five-factor demand, rent pressure, competition, seasonality and tourism readings for 60 Melbourne suburbs. Cafe score correlates with rent pressure at −0.58 (strongest single driver) and demand at +0.49 across the Melbourne set.
About the author
Locatalyze Research Team
Location intelligence, Locatalyze
The Locatalyze research team builds the location-scoring models behind the platform and writes up what the data shows for Australian operators.
Tools first — then a full report for your address
Free rent, viability, and break-even checks. Upgrade when you are ready for competitors, map, and numbers for a specific site.
No signup required for tools