Why Melbourne's Best Café Locations Work: A Data-Led Analysis of 10 Precincts
Locatalyze Research Team
Location intelligence, Locatalyze
Why do certain Melbourne café locations keep filling seats while other operators struggle on the next block, even when the coffee is competent and the fit-out looks expensive? Food and service matter. So does the address. This article examines ten Melbourne café precincts through a location-intelligence lens: catchment, income, accessibility, competition structure and demand timing. It is not a food ranking, and it does not claim access to any café's private revenue or profit.
Evidence standard
FACT: City of Melbourne Pedestrian Counting System (open counts) and ABS geography where linked. FACT: commercial rent anchors cited with vintages in body/sources. Precinct verdicts, score language and ‘what works’ framing are LOCATALYZE ANALYSIS. Fit-out and capture assumptions are MODELS / ESTIMATES unless a primary source is named.
Editorial note
This is a location assessment built from publicly observable market and demographic indicators, plus Locatalyze's published suburb methodology. It does not disclose or estimate any café's actual private financial results. Business performance depends on rent, operating costs, management, product quality, pricing and many other factors. Read our [methodology](/methodology) for how Locatalyze scores sites.
Key takeaways
Interactive · feel the trade-offs
Explore Melbourne's 10 café precincts
Filter by demand engine, find a fit for your capital and daypart, compare two strips side by side, then tick a site-visit checklist before you negotiate.
Fitzroy
Brunswick St / Gertrude St
87
Model café score
$2,194
Median HH income / wk
10,431
ABS 2021 residents
+25% vs Victorian median · median age 35
Advantage: National strip identity; deep daily routine
Main risk: Dense competition; trophy-frontage rent
Industry Beans — destination specialty coffee on a destination strip
Interactive shortlisting aid only. Model scores are Locatalyze suburb outputs (2026) where shown — not PROCEED / VERIFY / AVOID product verdicts. ABS figures describe geographic areas, not individual tenancies. Progress on the checklist saves in this browser.
10
Precincts analysed
ABS 2021
Census QuickStats cited
$1,759
Victorian median HH income / wk
54%
Café/restaurant/takeaway still trading after 4 years (TRA)
Standout café locations we would study first
If we had to name one publicly known Melbourne café that best illustrates a defensible destination-strip location, it would be Industry Beans on Fitzroy's specialty-coffee map — a long-running destination operator on a corridor where customers often choose the street first. That is a location lesson — strip identity and repeat catchment — not a claim about private revenue or profit. Actual financial results are not publicly available.
Two other publicly known anchors worth studying for different location lessons: St Ali on the South Melbourne / Clarendon Street axis (market-and-neighbourhood dual engines), and Auction Rooms on Errol Street, North Melbourne (weekday hospital-and-worker loyalty economics). Use them as geography markers when you walk the precinct. Do not treat queues or review volume as proof any lease on the same block will work.
Named venues are location anchors, not financial audits
We name cafés only where they help explain a precinct. Public reputation, press coverage and strip placement are observable. Private POS data, rent deals and profitability are not. This remains a location assessment.
Lifestyle publications already cover Melbourne brunch well. Broadsheet, Time Out and similar guides help customers choose where to eat. They rarely help a first-time operator decide whether a lease on Brunswick Street, Chapel Street or Sydney Road can carry wages, COGS and fit-out. Across Australia, only 54% of café, restaurant and takeaway businesses trading in June 2020 were still trading four years later, against 64% for all businesses (Tourism Research Australia, *Tourism Businesses in Australia*). Location is not the only cause of failure — but it is one of the few pre-opening decisions that is hard to reverse.
What follows is Locatalyze's precinct-level read of ten places that repeatedly attract café demand in Melbourne. We use ABS Census 2021 demographics, describe accessibility patterns operators can verify on site (including tram and train corridors), and flag competition and timing risks. Named streets and publicly known venues are geography anchors — not endorsements and not financial audits.
Search demand for "best cafés Melbourne" is overwhelmingly visitor intent. Lists answer with menus and queues. The commercial question underneath is different: which location characteristics keep demand arriving after the novelty week ends? ABS catchment data, strip structure, transit adjacency and competition density matter more than another ranked brunch plate.
Locatalyze's edge is not claiming secret POS data. It is structuring the same public and observational inputs an experienced leasing consultant would ask for — then forcing the operator to confront rent against realistic dayparts before emotion takes over the negotiation. For the ranked suburb view of the same market, see our companion piece on the best suburbs to open a café in Melbourne.
Quick findings
These signals are interpretive classifications for this article — the same ones powering the interactive explorer above. They are not Locatalyze product verdicts (PROCEED / VERIFY / AVOID) and they are not claims about any café's profitability.
How we assessed these locations
Each precinct was reviewed against eight practical categories: demand capacity (who lives and works nearby), competition structure (how crowded the category already is), accessibility (walkability, tram/train, parking friction), visibility (whether a shopfront can be discovered), customer fit (does the offer match the catchment), rent pressure (whether the strip typically prices like a prestige corridor), activity generators (universities, hospitals, markets, stations, beaches, stadiums), and data confidence (how much of the read is measured census data versus on-street interpretation).
Limitations matter. We did not install footfall sensors on every strip. We did not scrape private POS data. We did not verify every competitor count to the door. Where ABS figures are cited, they describe suburb or statistical areas, not a single tenancy's trade area. Where we refer to Locatalyze suburb models, treat those as directional decision-support outputs — useful for shortlisting, not a substitute for a solicitor, valuer or your own peak/off-peak site visits. Melbourne is unusual in that the City of Melbourne publishes an open Pedestrian Counting System — useful for CBD and some fringe corridors, still a ceiling rather than a sales forecast. Income and population figures use ABS Census 2021 QuickStats. Census 2026 QuickStats were not yet published when this article was last updated; we will refresh the figures when ABS releases them.
Tram and train catchments (how we treat them)
Rail and tram adjacency can stabilise weekday mornings when the walk from stop to counter is short and pleasant. We treat the following as primary transit catchments for this article (confirm service patterns on Public Transport Victoria): South Yarra Station for Chapel Street; Richmond and East Richmond for Swan Street; Southern Cross for Docklands/Batman's Hill; Glenferrie Station for Hawthorn; North Melbourne Station for Errol Street approaches; and the dense tram grid on Brunswick Street, Sydney Road, Lygon Street, Clarendon Street and St Kilda Road / Fitzroy Street. Station proximity is not a free customer. Always verify conversion on your specific frontage at the dayparts you need.
1. Fitzroy — Brunswick Street and Gertrude Street as destination strips
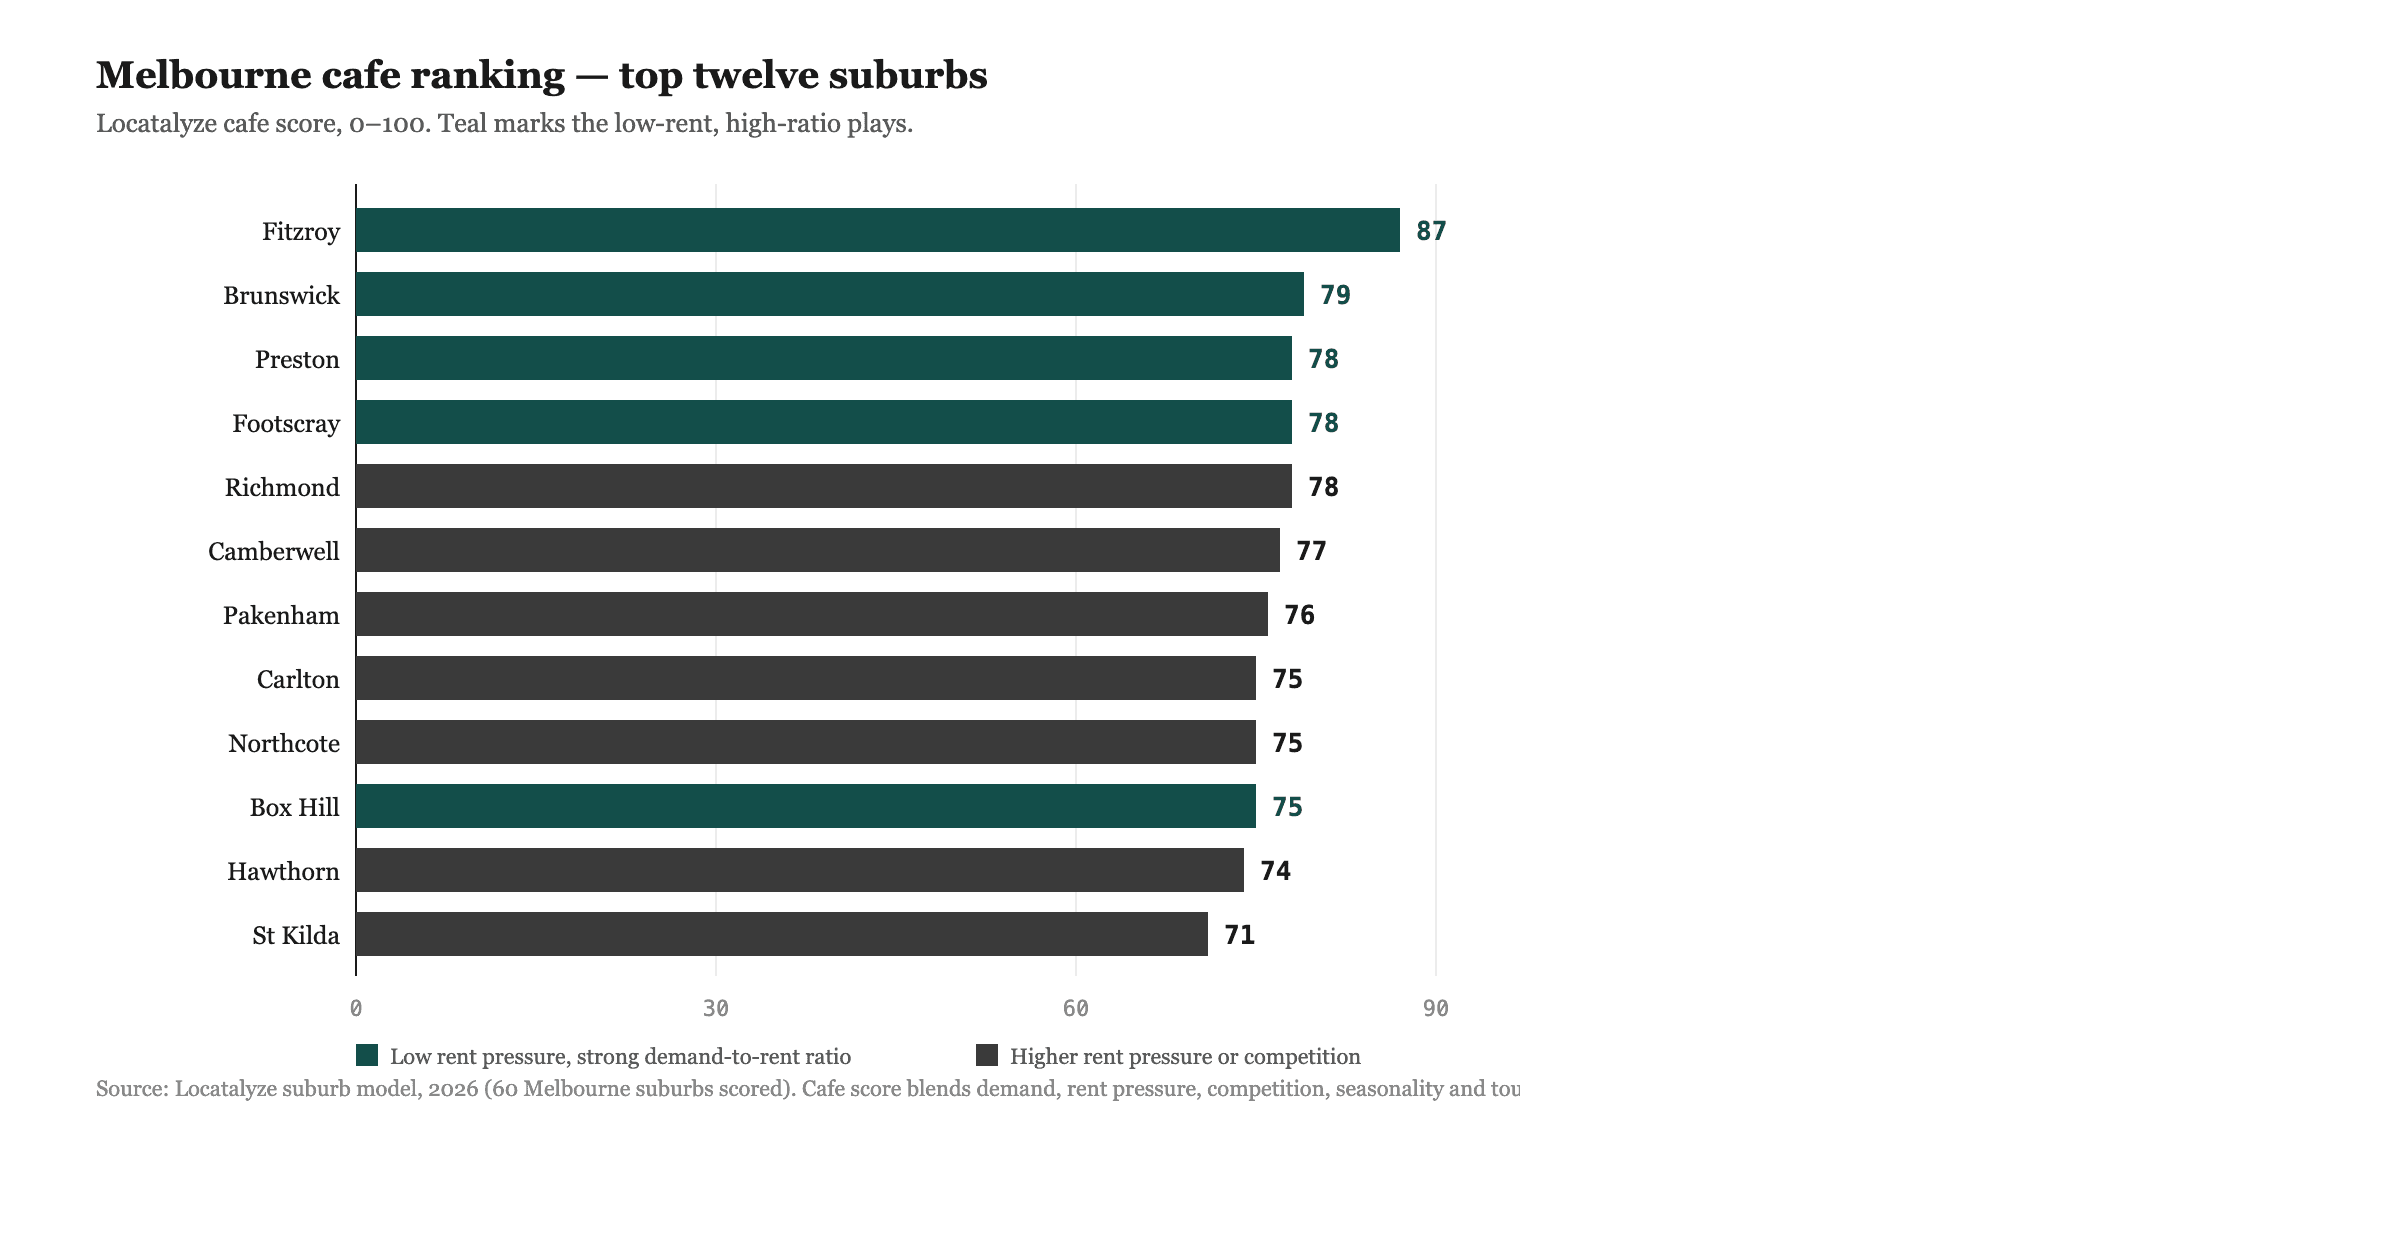
Fitzroy remains Melbourne's clearest example of a destination hospitality precinct. Public indicators support spending capacity: at the 2021 Census the suburb had 10,431 residents, a median age of 35, and median weekly household income of $2,194 — well above the Victorian median of $1,759 (ABS QuickStats, Fitzroy (Vic.)). Brunswick Street and Gertrude Street function as corridors where customers often choose the street first. Locatalyze's suburb model scores Fitzroy's café location at 87 with demand 10 and rent pressure only 4 at suburb average — a rare pairing (Locatalyze suburb model, 2026). That suburb average does not protect a trophy frontage where asking rents have already capitalised the reputation.
Location advantage: strip identity reduces cold discovery cost for a strong concept; the resident base is café-habitual. Main risk: dense competition and frontage rent that can erase the model's rent-pressure advantage. Lesson: on destination strips, differentiation and visibility beat "near a busy street" as a leasing argument — and lease one street back if the ratio is what you are buying. Data confidence: high on income (ABS); competition structure should be mapped door-by-door before you negotiate. For the live suburb read, see Fitzroy on Locatalyze.
2. Brunswick — Sydney Road loyalty and rent ratio
Brunswick's Sydney Road corridor is often compared with Fitzroy and should not be treated as interchangeable. At the 2021 Census Brunswick had 24,896 residents, a median age of 34, and median weekly household income of $2,096 (ABS QuickStats, Brunswick (Vic.)). The Locatalyze model scores the suburb café location at 79 with demand 9 and rent pressure 4 — one of the stronger demand-to-rent pairings in inner Melbourne (Locatalyze suburb model, 2026). The catchment skews younger and more rental-heavy than Fitzroy's settled creative-professional base, with student spillover from the northern university corridor.
Location advantage: comparable lifestyle demand at a typically more accessible rent envelope than Fitzroy prime (confirm with current listings). Main risk: competition clusters on the best stretches; a thin retail block without residential depth behind it underperforms the suburb score. Lesson: pick a block with genuine residential catchment, not just Sydney Road brand association. Data confidence: high on demographics; medium on micro-block footfall (observe yourself). See Brunswick café scores.
3. Carlton — university daytime and Lygon Street incumbency
Carlton is defined by the University of Melbourne to the south and Lygon Street's long-running hospitality identity. ABS figures show a young, lower-income resident base relative to other inner strips: 16,055 residents, median age 27, median weekly household income $1,292 — below the Victorian median of $1,759 (ABS QuickStats, Carlton (Vic.)). That is not a weak café catchment; it is a volume-and-daytime catchment. Cafés and restaurants and higher education are among the suburb's top employment industries in the Census — a structural signal that hospitality and the university are intertwined. Locatalyze scores Carlton café at 75 with demand 9, rent pressure 5 and competition 5 (Locatalyze suburb model, 2026).
Location advantage: large daytime student and staff flow when semester is on; heritage-tourism layer on weekends. Main risk: academic calendar empties a chunk of the catchment between semesters; competing head-on with Lygon Street Italian institutions on their own terms is a common failure mode. Lesson: design for high-throughput, efficient weekday coffee and be honest about semester troughs in the annual model. Data confidence: high on ABS; tourism volumes are directional.
4. Richmond — Swan Street, Bridge Road and event nights
Richmond combines professional residents, the Cremorne creative-office cluster south of Swan Street, and episodic stadium demand from the MCG and AAMI Park calendar. At the 2021 Census Richmond had 28,587 residents, a median age of 34, and median weekly household income of $2,245 (ABS QuickStats, Richmond (Vic.)). Locatalyze scores Richmond café at 78 with demand 9 and rent pressure 5 — solid viability that still assumes you trade across dayparts (Locatalyze suburb model, 2026).
Location advantage: multiple demand engines (residents, workers, event nights) if the offer and staffing can flex. Main risk: rent that only clears if every engine fires every week; event nights are real but uneven. Lesson: model a non-event Tuesday as carefully as a Friday night football crowd. Data confidence: high on ABS income; event conversion is site-specific.
Shortlisting a Melbourne café lease? Run the exact address through Locatalyze before you negotiate — demand, competition and rent pressure in one report.
Free location score, map, data confidence and PROCEED / VERIFY / AVOID recommendation. Modelled financials stay optional.
Analyse your Melbourne addressThat is the practical difference from a brunch list: an address-level checklist you can argue with a landlord about. See a sample report or start with your Melbourne address.
5. South Melbourne — market weekends and Clarendon Street locals
South Melbourne pairs a high-income resident base with South Melbourne Market as a weekend activity generator and Clarendon Street as the commercial spine. At the 2021 Census the suburb had 11,548 residents, a median age of 39, and median weekly household income of $2,101 (ABS QuickStats, South Melbourne). Publicly known operators such as St Ali illustrate how a destination coffee brand can sit on a neighbourhood-and-market dual engine — geography, not a profit claim.
Location advantage: market-driven discovery on peak days plus resident weekday potential. Main risk: assuming Saturday market energy is your Monday–Friday floor. Lesson: count the quiet weekdays on your exact frontage before you underwrite annual rent on market photographs. Data confidence: high on ABS; market pedestrian intensity varies by day and season.
6. South Yarra — Chapel Street premium and station footfall
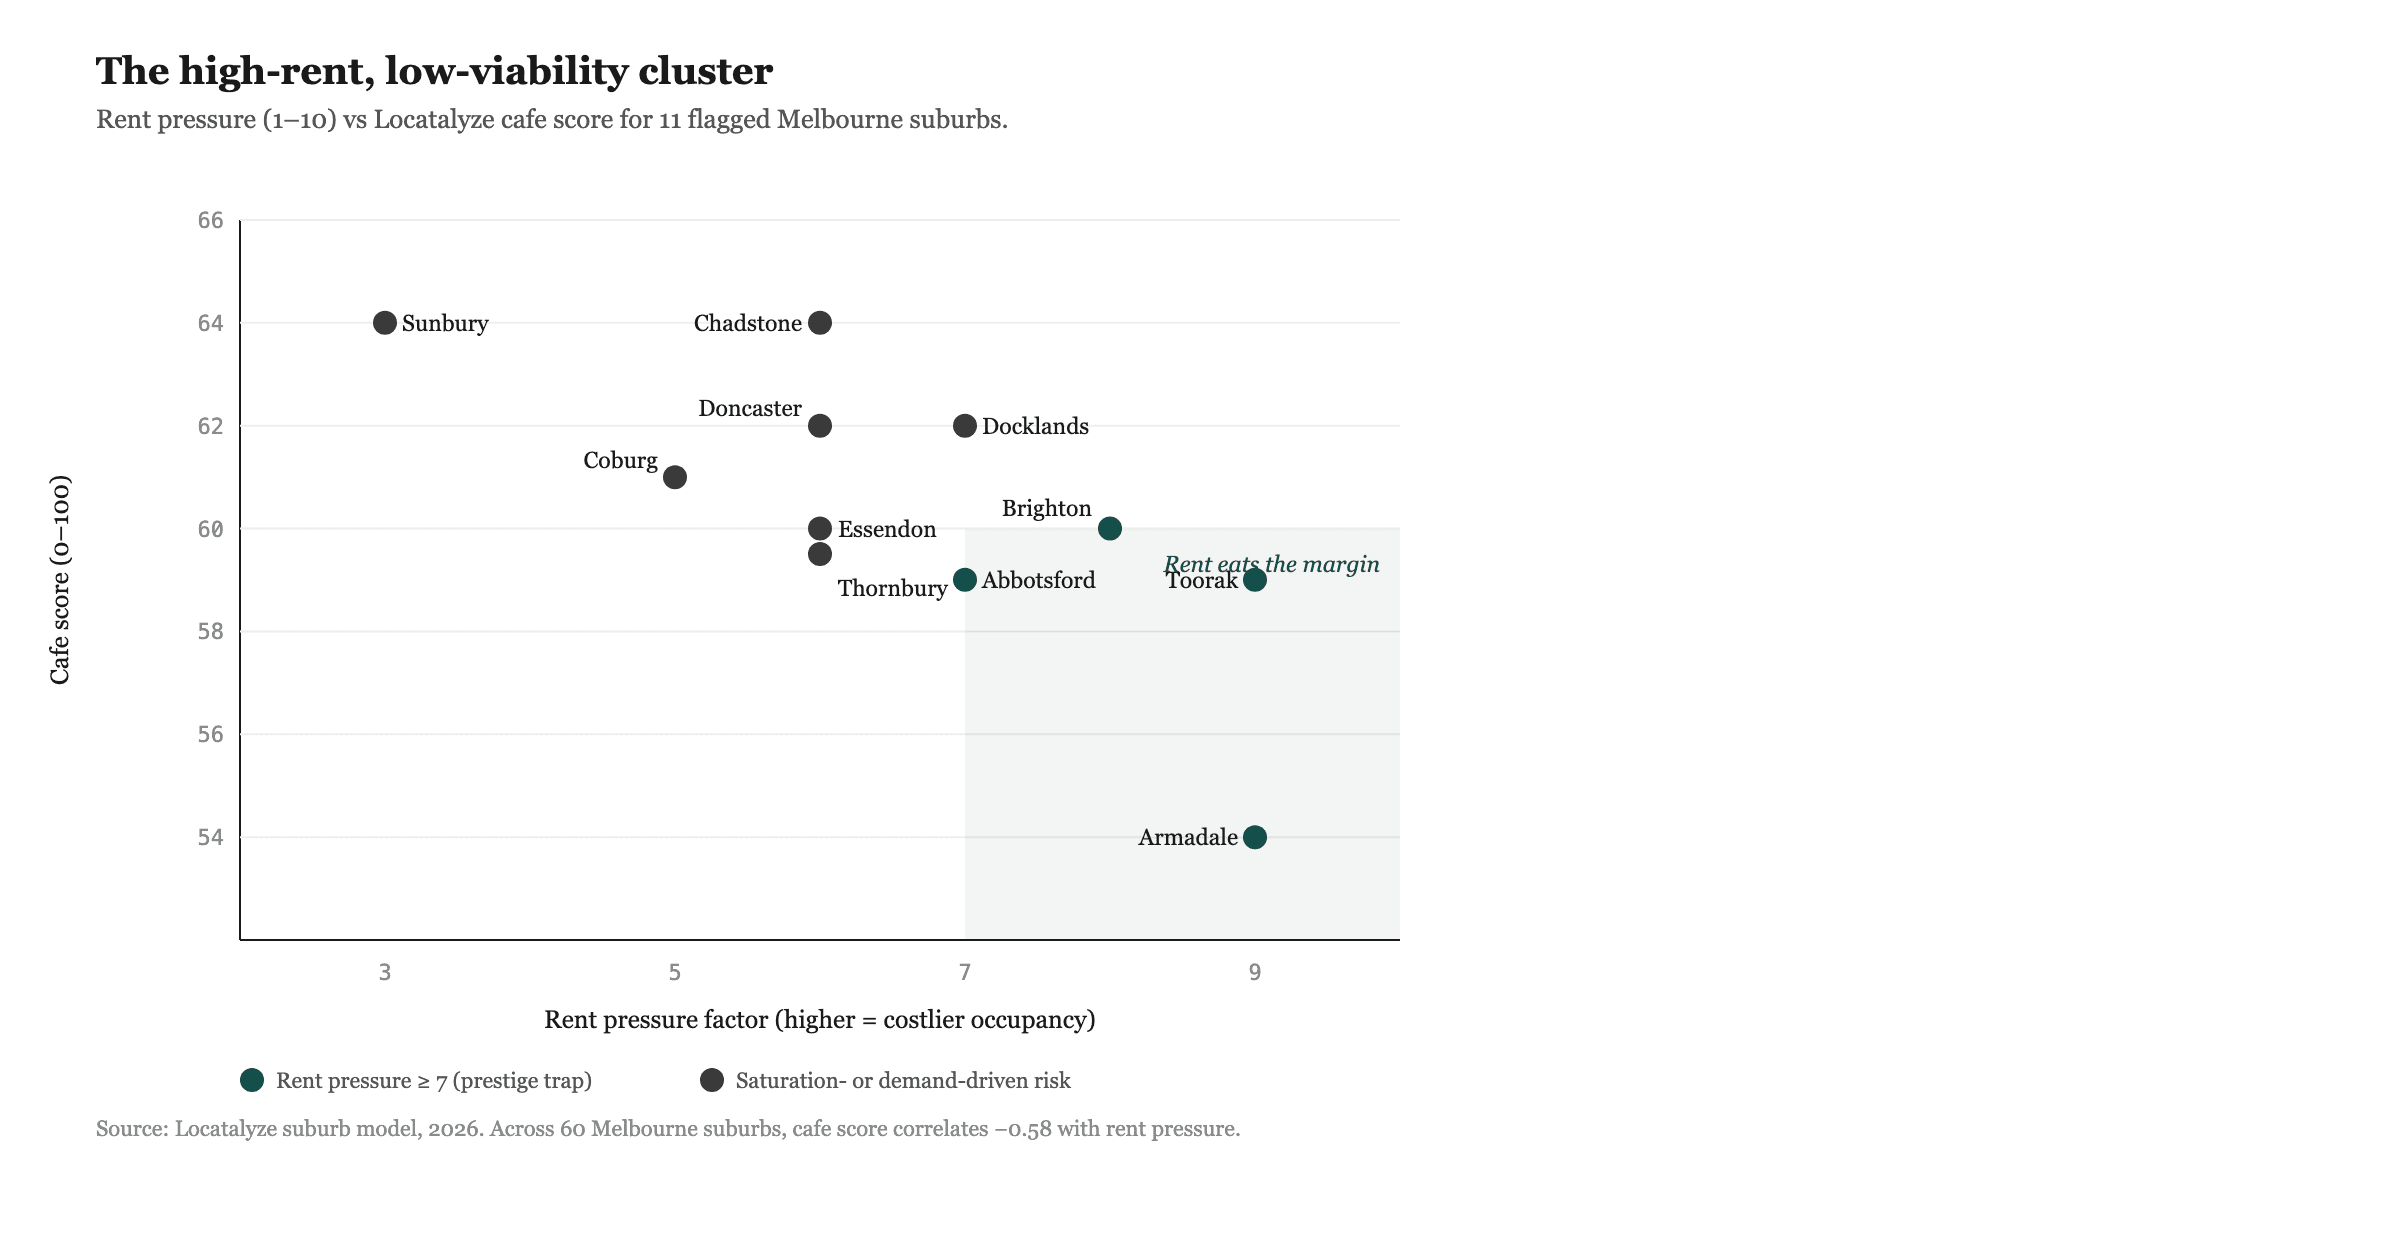
South Yarra is the classic pay-to-play inner-south strip. At the 2021 Census it had 25,028 residents, a median age of 33, and median weekly household income of $2,063, with a notably high personal income of $1,395 weekly (ABS QuickStats, South Yarra). Locatalyze scores South Yarra café at 75 with demand 10 but rent pressure 7 — top-tier demand that hands a large share back as rent (Locatalyze suburb model, 2026). South Yarra Station creates genuine corridor spikes; those spikes are already priced into prime Chapel Street leases.
Location advantage: spending capacity and discovery on a nationally known strip. Main risk: occupancy cost that punishes any soft week. Lesson: if you need prestige, negotiate incentives hard and prove weekday conversion, not just Saturday brunch queues. Data confidence: high on ABS; rent must be verified tenancy-by-tenancy.
7. St Kilda — coastal tourism with a resident floor
St Kilda's Acland Street and Fitzroy Street precincts mix coastal visitors with a large renter and creative resident base. At the 2021 Census St Kilda had 19,490 residents, a median age of 36, and median weekly household income of $1,779 — close to the Victorian median of $1,759 (ABS QuickStats, St Kilda (Vic.)). Locatalyze scores St Kilda café at 71 with demand 9, rent pressure 6 and tourism 8 — the highest tourism reading in this set, and a penalty for café-specific fragility (Locatalyze suburb model, 2026).
Location advantage: strong summer and weekend discovery when weather cooperates. Main risk: seasonality and tourism volatility; a wet winter Tuesday can look nothing like a January Saturday. Lesson: never underwrite annual rent on peak foreshore weekends alone; model resident weekday trade as the floor. Data confidence: high on ABS; visitor volumes are directional.
8. Hawthorn — Glenferrie Road income quality
Hawthorn's Glenferrie Road and Burwood Road spines sit in one of Melbourne's higher-income inner-east catchments, with Swinburne University adding a student daypart on Glenferrie. At the 2021 Census Hawthorn had 22,322 residents, a median age of 34, and median weekly household income of $2,145 (ABS QuickStats, Hawthorn (Vic.)). Locatalyze scores Hawthorn café at 74 with demand 8, rent pressure 5 and competition 4 — solid, contained, and sensitive to rent (Locatalyze suburb model, 2026).
Location advantage: income quality and a university overlay without Fitzroy-level strip saturation. Main risk: affluent residents who dine elsewhere on weeknights; weekend-weighted concepts can starve midweek. Lesson: build a weekday-capable offer near Glenferrie Station and campus flow, not a Saturday-only brunch room. Data confidence: high on ABS.
9. North Melbourne — Errol Street weekday loyalty
North Melbourne's Errol Street village is a weekday-worker story first. At the 2021 Census the suburb had 14,953 residents, a median age of 31, and median weekly household income of $1,717 — slightly below the Victorian median (ABS QuickStats, North Melbourne). Public indicators and operator guides consistently point to hospital and university-adjacent morning trade as the structural engine, with weekend visitor flow as a supplement rather than the base. Locatalyze factors read demand 8, rent pressure 6 and competition 6 — viability that punishes a weekend-only concept (Locatalyze suburb model, 2026).
Location advantage: reliable weekday morning loyalty when hospital and worker dayparts convert. Main risk: models that import Fitzroy weekend assumptions into Errol Street. Lesson: verify 7am–9:30am Monday–Friday on your frontage before you care about Saturday Instagram. Data confidence: high on ABS; worker conversion is observational.
10. Docklands — office lunch and evening gaps
Docklands is Melbourne's planned waterfront precinct west of the CBD — office towers, apartment growth and harbour promenades. At the 2021 Census Docklands had 15,495 residents, a median age of 32, and median weekly household income of $1,957 (ABS QuickStats, Docklands). Locatalyze factors read demand 7, rent pressure 7, competition 4 and seasonality elevated — weekday lunch can look strong while evenings and weather-exposed weekends underperform (Locatalyze suburb model, 2026). Southern Cross Station and Batman's Hill feed pedestrian intensity that still has to convert at your door.
Location advantage: weekday office density and a growing apartment base. Main risk: paying CBD-fringe rent for a catchment that empties after 6pm; weather and event dependency on the harbour edge. Lesson: stress-test Tuesday evening and rainy Sundays before treating lunch queues as proof of concept. Data confidence: high on ABS residents; office headcount is directional and changes with attendance patterns.
Patterns across Melbourne café locations that work
Across these ten precincts, the recurring lesson is simple: successful café locations make it easier for the right customer to say yes at the right time of day. Income, tram corridors, strip identity, universities, markets and destination pull are mechanisms for that yes — not proof any existing venue is privately profitable.
What to verify before you sign a Melbourne café lease
Use the Site checklist tab in the interactive explorer above — progress saves in this browser — or work through the same list here:
- 1
Written face rent, outgoings, incentives and lettable area (GLAR/NLA) in one schedule.
- 2
Competitor map within a realistic walking catchment — not a vibe check on one Saturday.
- 3
Pedestrian counts at your critical dayparts (weekday open, weekday lunch, weekend brunch).
- 4
Parking restrictions, loading access and outdoor seating approvals with the City of Melbourne, Yarra, Port Phillip, Stonnington or Boroondara as relevant.
- 5
Planning use class and any food-premises requirements before you pay for design.
- 6
Break-even covers at your ticket size — if rent needs heroic volume, renegotiate or walk.
- 7
Seasonal and weather sensitivity if the precinct is coastal, harbour-edge or tourist-led.
- 8
Fit-out scope, landlord contribution and make-good obligations.
When Locatalyze can help
If you already have an address — or a shortlist of two or three — Locatalyze is built to stress-test the site before the lease becomes emotional. The report structures demand, competition, demographics and rent pressure for Australian café and hospitality formats. It does not replace legal advice or a valuation. It does replace guessing from Instagram queues. Start with a Melbourne café suburb overview, review pricing, see a sample report, or analyse your address.
Considering opening a café in Melbourne? Analyse the proposed address before committing to the lease.
Free location score, map, data confidence and PROCEED / VERIFY / AVOID recommendation. Modelled financials stay optional.
Start a location reportRelated reading
Disclaimer
This article assesses publicly observable location and market indicators. It does not disclose or estimate any café's actual private financial results. Business performance depends on rent, operating costs, management, product quality, pricing and many other factors. Figures from the ABS Census 2021 describe geographic areas, not individual tenancies. Always verify current leases, council rules and on-site trading patterns before signing.
Sources
Frequently asked questions
About the author
Locatalyze Research Team
Location intelligence, Locatalyze
The Locatalyze research team builds the location-scoring models behind the platform and writes up what the data shows for Australian operators.
Tools first — then a full report for your address
Free rent, viability, and break-even checks. Upgrade when you are ready for competitors, map, and numbers for a specific site.
No signup required for tools