Why Perth's Best Café Locations Work: A Data-Led Analysis of 10 Precincts
Locatalyze Research Team
Location intelligence, Locatalyze
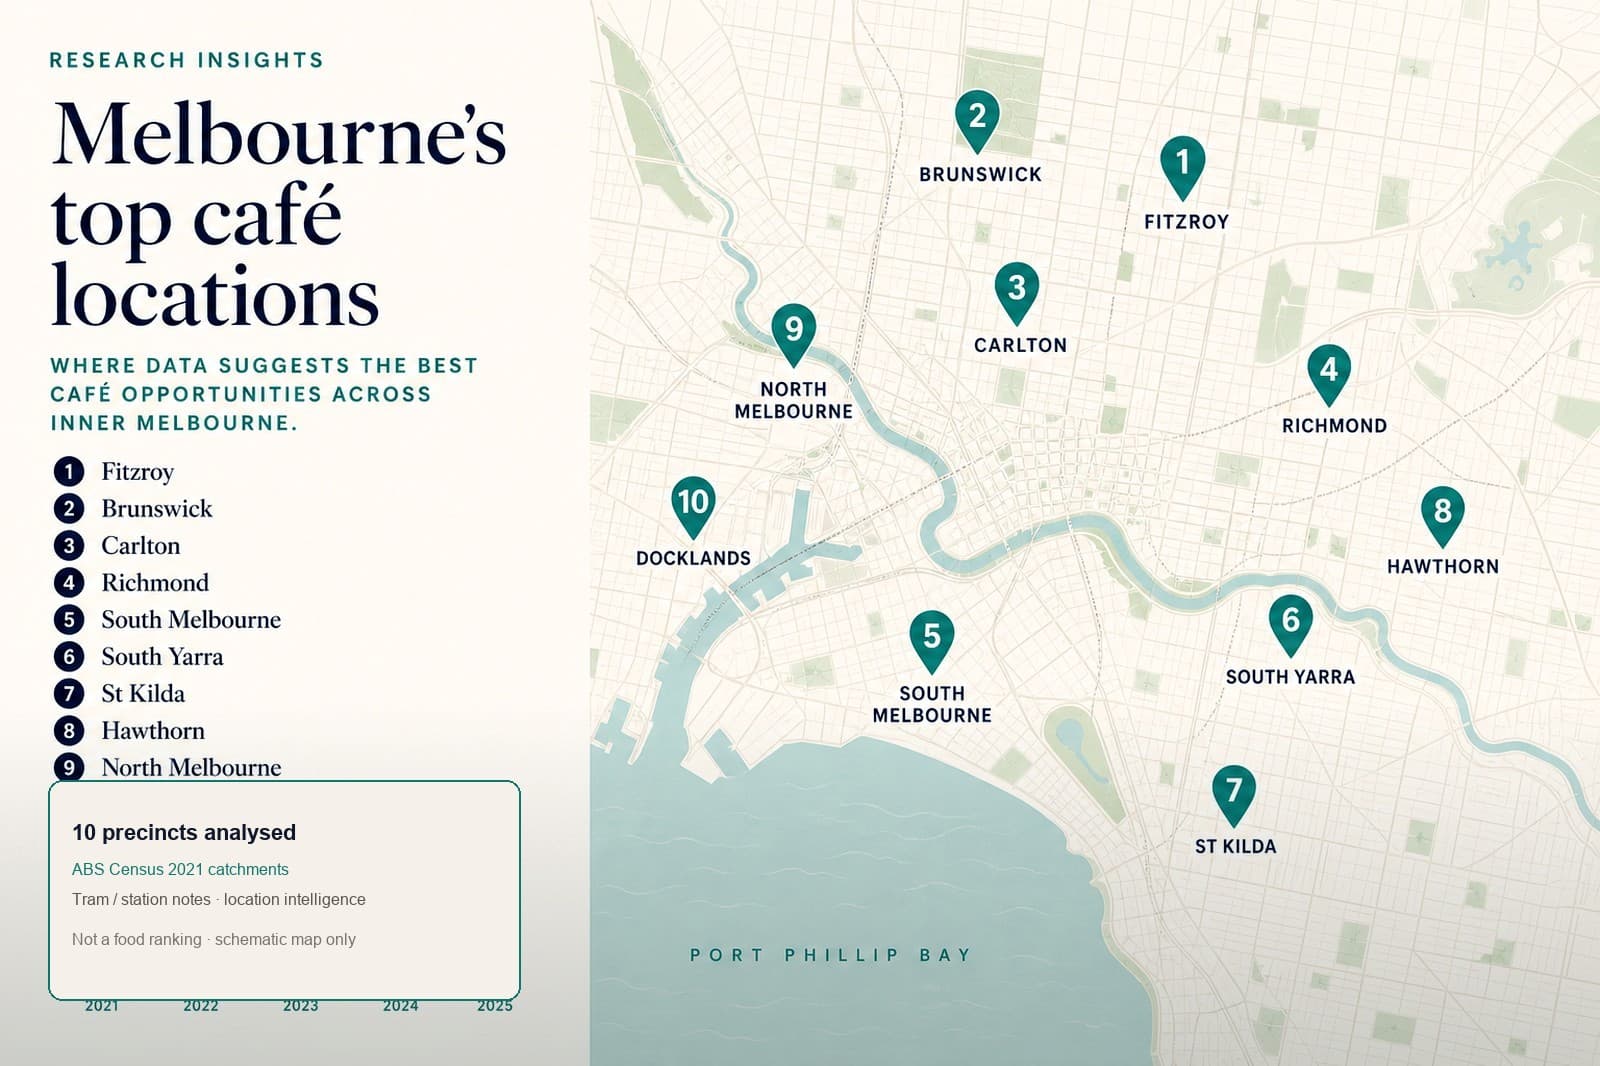
Why do certain Perth café locations keep filling seats while other operators struggle on the next block, even when the coffee is competent and the fit-out looks expensive? Food and service matter. So does the address. This article examines ten Perth café precincts through a location-intelligence lens: catchment, income, accessibility, competition structure and demand timing. It is not a food ranking, and it does not claim access to any café's private revenue or profit.
Evidence standard
FACT: ABS QuickStats and named planning/transport sources where linked. FACT: CBRE/Colliers-style vacancy or rent cites carry their vintages in body/sources. Precinct comparisons and operator guidance are LOCATALYZE ANALYSIS. Rent brackets without an opened primary table are ESTIMATES.
Editorial note
This is a location assessment built from publicly observable market and demographic indicators, plus Locatalyze’s published suburb methodology. It does not disclose or estimate any café’s actual private financial results. Business performance depends on rent, operating costs, management, product quality, pricing and many other factors. Read our [methodology](/methodology) for how Locatalyze scores sites.
Key takeaways
Standout café locations we would study first
If we had to name one publicly known Perth café that best illustrates a defensible destination-strip location, it would be Mary Street Bakery on Beaufort Street, Highgate. The venue is a long-running neighbourhood institution with multiple Perth sites; the Highgate shopfront sits on a destination hospitality corridor where customers often choose the street first. That is a location lesson — strip identity and repeat catchment — not a claim about private revenue or profit. Actual financial results are not publicly available.
Two other publicly known anchors worth studying for different location lessons: Smidge Bakery on Oxford Street, Leederville (compact loyalty-strip economics — covered in recent West Australian food press), and For The Record Coffee House in Fremantle (destination specialty coffee inside a tourist-and-local mixed strip). Use them as geography markers when you walk the precinct. Do not treat queues or review volume as proof any lease on the same block will work.
Named venues are location anchors, not financial audits
We name cafés only where they help explain a precinct. Public reputation, press coverage and strip placement are observable. Private POS data, rent deals and profitability are not. This remains a location assessment.
Lifestyle publications already cover Perth brunch well. Urban List and similar guides help customers choose where to eat. They rarely help a first-time operator decide whether a lease on Rokeby Road, Beaufort Street or Albany Highway can carry wages, COGS and fit-out. Across Australia, only 54% of café, restaurant and takeaway businesses trading in June 2020 were still trading four years later, against 64% for all businesses (Tourism Research Australia, *Tourism Businesses in Australia*). Location is not the only cause of failure, but it is one of the few decisions you make before you open that is hard to reverse.
What follows is Locatalyze’s precinct-level read of ten places that repeatedly attract café demand in Perth. We use ABS Census 2021 demographics where available, describe accessibility patterns that operators can verify on site (including Transperth corridors), and flag competition and timing risks. Named streets and publicly known venues are anchors for geography, not endorsements and not financial audits.
Search demand for “best cafés Perth” and “best brunch Perth” is overwhelmingly visitor intent. Lists answer that intent with menus, interiors and queues. The commercial question underneath is different: which location characteristics keep demand arriving after the novelty week ends? That is where ABS catchment data, strip structure, transit adjacency and competition density become more useful than another ranked brunch plate.
Locatalyze’s edge is not claiming secret POS data. It is structuring the same public and observational inputs an experienced leasing consultant would ask for — then forcing the operator to confront rent against realistic dayparts before emotion takes over the negotiation.
Quick findings
These signals are interpretive classifications for this article. They are not Locatalyze product verdicts (PROCEED / VERIFY / AVOID) and they are not claims about any café’s profitability.
How we assessed these locations
Each precinct was reviewed against eight practical categories: demand capacity (who lives and works nearby), competition structure (how crowded the category already is), accessibility (walkability, Transperth, parking friction), visibility (whether a shopfront can be discovered), customer fit (does the offer match the catchment), rent pressure (whether the strip typically prices like a prestige corridor), activity generators (stations, beaches, retail centres, cultural anchors), and data confidence (how much of the read is measured census data versus on-street interpretation).
Limitations matter. We did not install footfall sensors. We did not scrape private POS data. We did not verify every competitor count to the door. Where ABS figures are cited, they describe suburb or local-government areas, not a single tenancy’s trade area. Where we refer to Locatalyze suburb models, treat those as directional decision-support outputs — useful for shortlisting, not a substitute for a solicitor, valuer or your own peak/off-peak site visits. For a deeper first-timer framing of Perth suburbs, see our guide to best Perth suburbs for a first-time café. Income and population figures use ABS Census 2021 QuickStats. Census 2026 QuickStats were not yet published when this article was last updated; we will refresh the figures when ABS releases them.
Transperth catchments (how we treat them)
Rail adjacency can stabilise weekday mornings when the walk from platform to counter is short and pleasant. We treat the following as primary station catchments for this article (confirm service patterns on Transperth Stations and Stops): Subiaco Station for Rokeby Road; Leederville Station for Oxford Street; Perth Station for CBD lunch trade; Claremont Station for the western-suburbs retail spine; Fremantle Station for the Market Street / South Terrace approach. Scarborough foreshore is bus-led rather than rail-led — frequency and stop placement matter more than a train brand. Station proximity is not a free customer. Always verify conversion on your specific frontage at the dayparts you need.
1. Subiaco — Rokeby Road and the station corridor
Subiaco remains one of Perth’s clearest examples of a dual-engine café strip. Weekday mornings appear to benefit from residents and workers moving through Subiaco Station and the Rokeby Road retail spine. Weekends appear to benefit from an established inner-suburb food culture and destination shopping. Public indicators support spending capacity: the City of Subiaco’s median weekly household income was $2,140 at the 2021 Census, above the Western Australian median of $1,815 (ABS QuickStats, Subiaco LGA).
Location advantage: two different dayparts can feed the same counter if the offer is designed for both. Main risk: mature competition and prestige rent. A lease that only works if every seat turns on Saturday brunch is fragile by Tuesday afternoon. Lesson: before you sign on Rokeby Road, count pedestrians on a weekday at 7:45am and again on a Saturday at 10am. If one window is empty, your model needs a second revenue story or a lower rent. Data confidence: high on income (ABS); medium on footfall (observe yourself); low on any café’s private sales.
2. Leederville — Oxford Street loyalty economics
Leederville’s Oxford Street strip is smaller and more residential than Subiaco’s prestige spine. ABS figures show a high-income, compact suburb: median weekly household income $2,316 and only about 1,929 private dwellings at the 2021 Census (ABS QuickStats, Leederville). That combination often supports regulars rather than pure impulse walk-past volume.
Location advantage: loyalty and ticket quality can matter more than raw pedestrian counts. Recent local coverage of neighbourhood bakeries on Oxford Street (including Smidge Bakery) underlines how compact strips reward repeat locals. Main risk: formats that need constant tourist or office throughput may underperform. Lesson: design for repeat weekday coffee and weekend brunch among locals, not for anonymous CBD lunch queues. Data confidence: high on demographics; medium on competition intensity (verify by walking the strip). Transperth Leederville Station sits on the northern edge of the strip — useful for weekday workers if your frontage converts that walk.
3. Mount Lawley — Beaufort Street as a destination strip
Beaufort Street through Mount Lawley and Highgate functions as a destination hospitality corridor. Median weekly household income was $2,108 in 2021 (ABS QuickStats, Mount Lawley). Publicly, the strip’s reputation pulls customers who choose the street first and the venue second — which is powerful when you are discovered, and punishing when you are undifferentiated. Mary Street Bakery at 507 Beaufort Street, Highgate, is the clearest public example of that strip-identity effect: a long-running destination café-bakery that helped define how Perth reads this corridor. Naming it explains geography. It is not an endorsement of any lease next door, and it is not a profit claim.
Location advantage: strip identity reduces cold discovery cost for a strong concept. Main risk: prime frontage competition is intense; secondary bays may sit metres off the pedestrian desire line. Lesson: on destination strips, differentiation and visibility beat “near a busy street” as a leasing argument. Data confidence: high on income; competition structure should be mapped door-by-door before you negotiate.
4. Northbridge — footfall without a free lunch
Northbridge concentrates hospitality, nightlife and visitor movement north of the Perth CBD. Pedestrian intensity can look impressive on a Friday night or weekend brunch window. That does not automatically translate into café unit economics. Many operators confuse crowded footpaths with convertible customers.
Location advantage: discovery and social destination demand. Main risks: category saturation, evening-skewed trade, and a customer mix that may not build weekday morning regulars. Lesson: if your P&L needs Monday–Thursday espresso volume, verify those dayparts separately from Saturday night energy. Data confidence: medium — strong qualitative pattern, weak public footfall numerics.
5. Perth CBD — workers, transit and vacancy
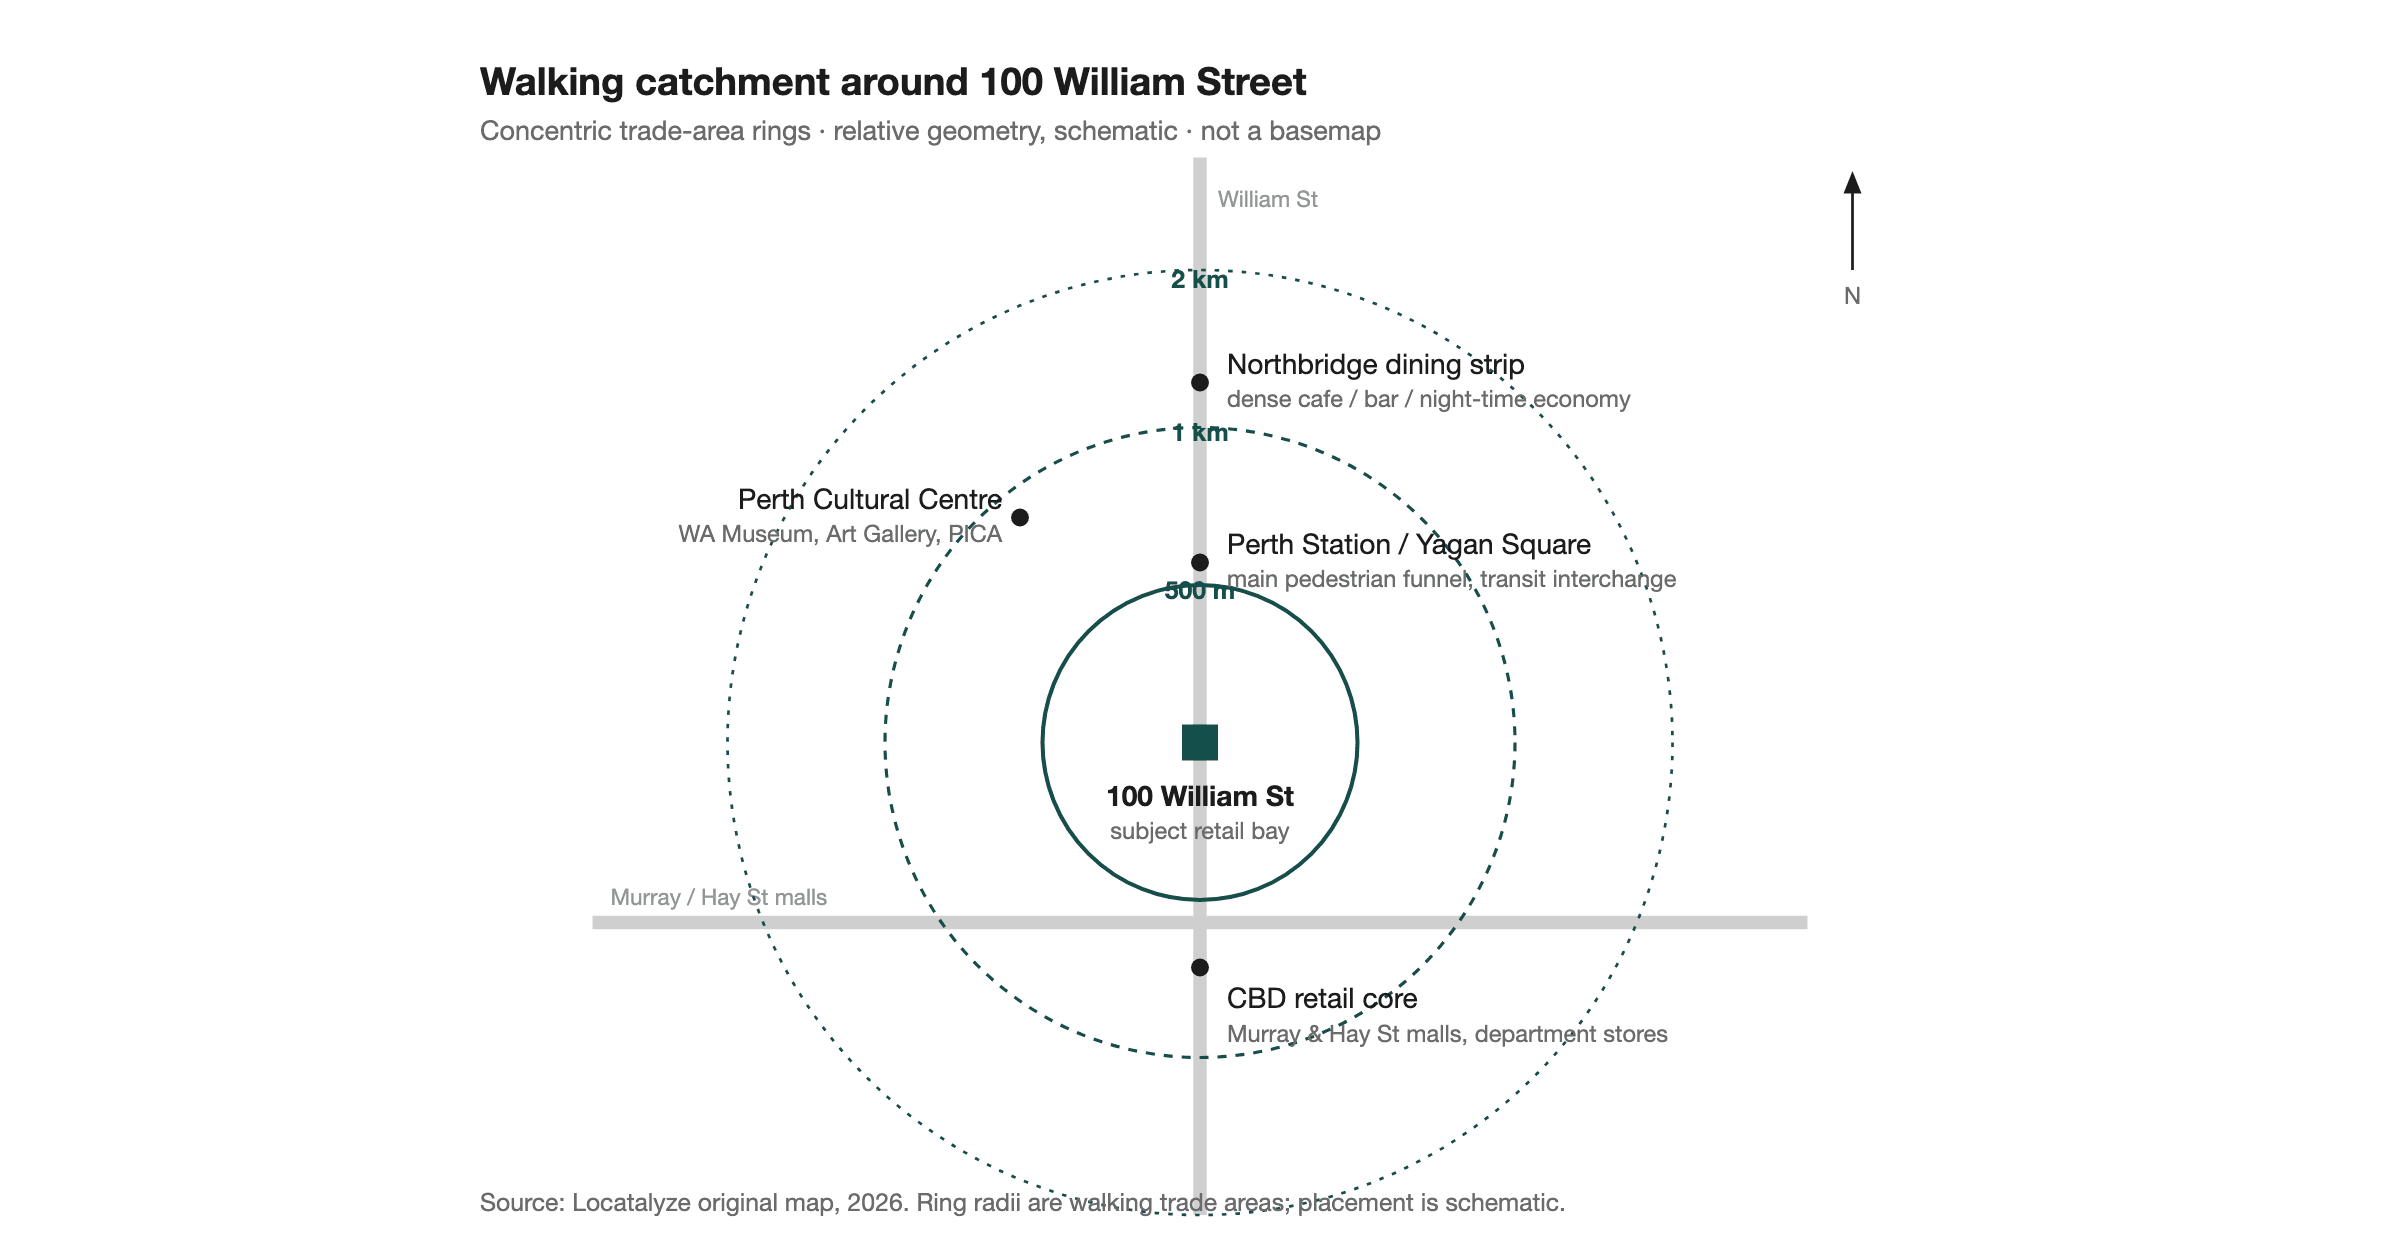
The CBD offers daytime worker density and transit funnels around Perth Station and the Hay/Murray malls. It also carries structural risk: Perth’s CBD retail vacancy was reported at 21.7% in H1 2025 against a national CBD average of 11.1% (CBRE, Australian CBD Retail Vacancy, H1 2025). A busy lunchtime street can still sit in a market where empty shopfronts signal soft demand after hours. By H1 2026 CBRE’s national CBD retail vacancy was about 10.8%, with Perth still elevated near 18.5% (CBRE H1 2026 as reported by Inside Retail (24 Aug 2026) / retailbiz (secondary; CBRE PDF not opened as free primary)) — improved from H1 2025, still the high end of the capital-city set.
For a street-level teardown of this tension, see our analysis of 100 William Street, Perth. Lesson: model the dark hours. If evenings and Sundays are quiet, rent must clear on a shorter trading week. Data confidence: high on vacancy citation; medium on any specific bay’s pedestrian yield.
Shortlisting a Perth café lease? Run the exact address through Locatalyze before you negotiate — demand, competition and rent pressure in one report.
Free location score, map, data confidence and PROCEED / VERIFY / AVOID recommendation. Modelled financials stay optional.
Analyse your Perth addressThat is the practical difference from a brunch list: an address-level checklist you can argue with a landlord about. See a sample report or start with your Perth address.
6. North Perth — Angove Street neighbourhood economics
Angove Street reads as a neighbourhood village more than a tourist destination. North Perth had 9,623 residents and a median weekly household income of $2,323 at the 2021 Census (ABS QuickStats, North Perth). That profile can support regulars if the offer matches local habits.
Location advantage: community familiarity and walk-up loyalty. Main risk: limited office and tourist buffers if residents change habits. Lesson: neighbourhood sites live or die on consistency and local reputation, not Instagram destination peaks. Data confidence: high on ABS population and income.
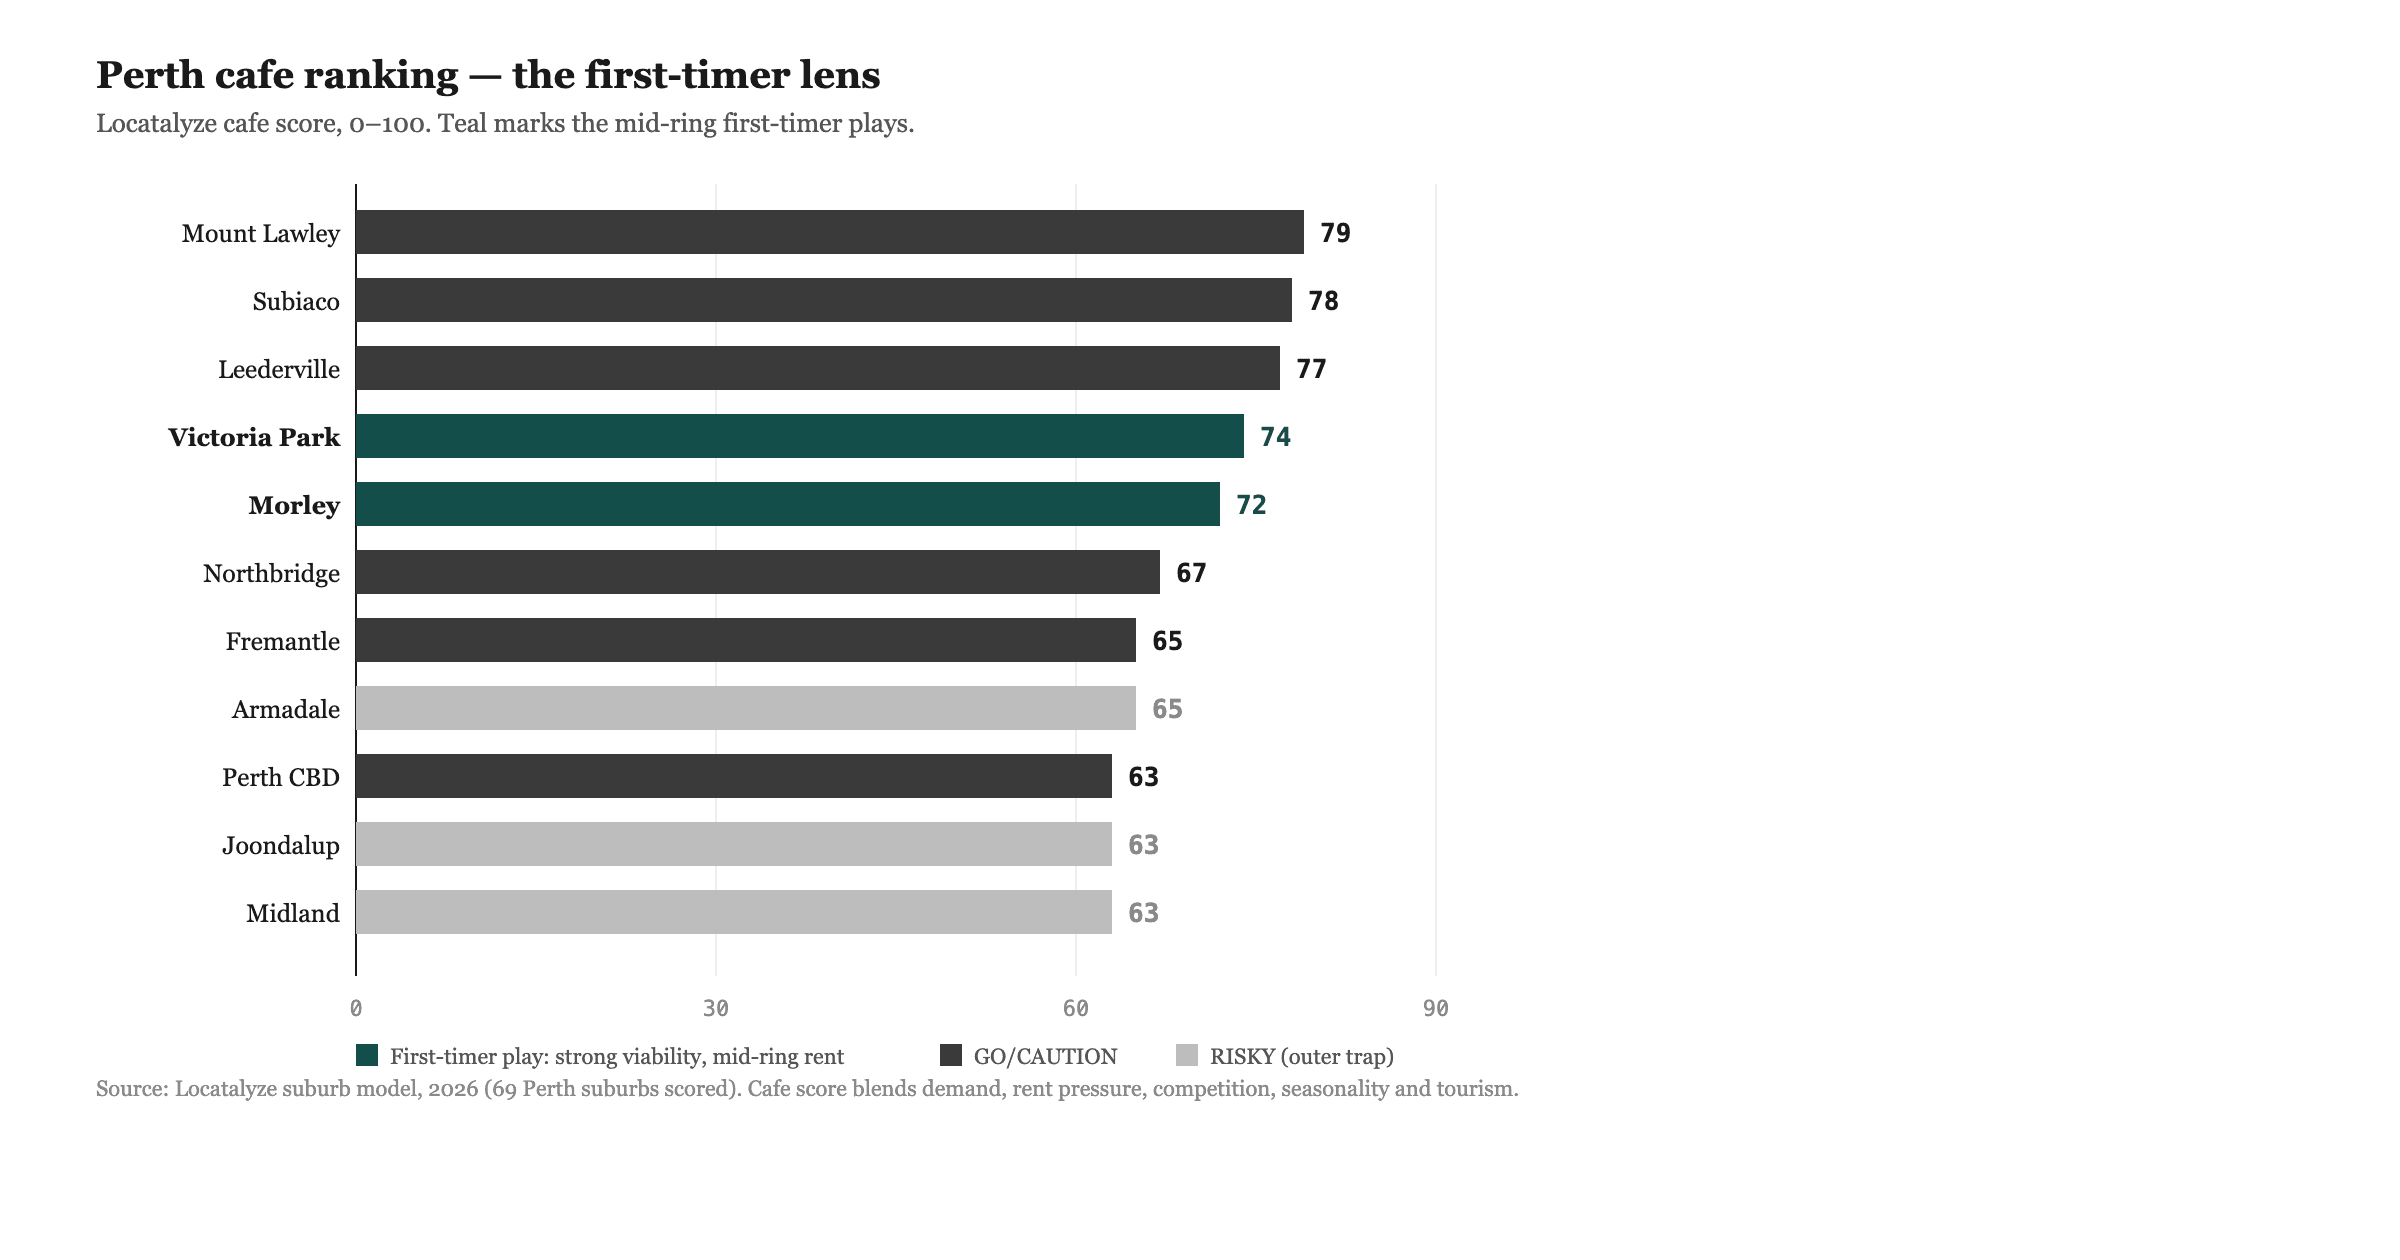
7. Victoria Park — mid-ring catchment and first-timer maths
Victoria Park’s Albany Highway corridor is often discussed as a more accessible entry than Mount Lawley or Subiaco. The City of Victoria Park had 36,889 residents, a median age of 36, and median weekly household income of $1,844 in 2021 — close to the WA median of $1,815 (ABS QuickStats, Victoria Park LGA). Younger mid-ring catchments can be forgiving of a fair, honest offer while still requiring discipline on rent.
Location advantage: typically less prestige rent pressure than inner-premium strips (confirm with current listings and a solicitor). Main risk: weaker destination pull means marketing and local loyalty matter more. Lesson: for many first-time operators, a workable mid-ring lease beats an unworkable prestige lease. Data confidence: high on demographics; rent must be verified locally.
8. Claremont — affluent western-suburbs destination
Claremont’s retail and café offer sits in one of Perth’s higher-income western corridors. The Town of Claremont recorded median weekly household income of $2,252 and 11,284 residents in 2021 (ABS QuickStats, Claremont LGA). Spending capacity appears strong; customer expectations and competition for quality concepts also tend to be high.
Location advantage: income quality and destination shopping adjacency. Main risk: high-cost execution and customers who will switch if the experience slips. Lesson: affluent catchments raise the ceiling and the standard. Data confidence: high on income; concept fit is operator-dependent.
9. Scarborough foreshore — destination demand with seasonal edges
For the foreshore catchment we use the ABS Scarborough SA2 (code 505021092) — the statistical area that covers the beachfront and surrounding residential blocks operators typically mean when they say “Scarborough café.” At the 2021 Census the SA2 had 17,552 residents, a median age of 36, median weekly household income of $2,108 (above the WA median of $1,815), and 7,622 occupied private dwellings (ABS QuickStats, Scarborough SA2). That income profile supports spending capacity; the foreshore itself still adds a leisure and visitor layer that census household figures alone cannot describe.
Location advantage: strong leisure destination pull when weather and events cooperate, plus a residential base with above-median income. Main risk: seasonality and weather dependency — a warm Saturday can look nothing like a midweek winter morning. Lesson: never underwrite annual rent on peak summer weekends alone; model the quiet weeks using local resident trade as the floor. Data confidence: high on SA2 demographics (ABS); medium on visitor volumes (observe dayparts yourself). Scarborough is primarily bus-served rather than rail — verify corridor frequency on Transperth Stations and Stops.
10. Fremantle — tourists, locals and strip density
Fremantle’s South Terrace and Market Street precincts combine resident demand with visitor traffic. The City of Fremantle had 31,930 residents, a median age of 42, and median weekly household income of $1,887 in 2021 (ABS QuickStats, Fremantle LGA). Destination Perth and related tourism materials consistently position Fremantle as a hospitality drawcard — useful for awareness, volatile as a sole revenue engine. Specialty coffee venues such as For The Record Coffee House illustrate how a strong concept can still need both tourist discovery and local weekday regulars. For suburb-level score context, see our Fremantle café/restaurant analyse page.
Location advantage: iconic destination identity and mixed visitor/local flow, with Fremantle Station feeding the CBD end of the walk. Main risk: tourist swings and dense competition on the primary strips. Lesson: separate local weekday coffee from weekend visitor brunch in your forecast. Data confidence: high on ABS; tourism volumes vary by season and should be treated as directional.
Operators often underestimate how differently Fremantle trades when cruise ships, school holidays and hot weekends stack versus a quiet weekday in winter. Public tourism positioning explains why the strip stays famous; it does not tell you whether your particular bay converts passers-by at 7am on a Tuesday. Walk both extremes before you treat destination fame as a revenue assumption.
Patterns across Perth café locations that work
Across these ten precincts, the recurring commercial lesson is boring and valuable: successful café locations usually make it easier for the right customer to say yes at the right time of day. Income, transit, strip identity and destination pull are mechanisms for that yes. None of them replace operator execution — and none of them should be confused with proof that an existing venue is privately profitable.
What to verify before you sign a Perth café lease
- 1
Written face rent, outgoings, incentives and lettable area (GLAR/NLA) in one schedule.
- 2
Competitor map within a realistic walking catchment — not a vibe check on one Saturday.
- 3
Pedestrian counts at your critical dayparts (weekday open, weekday lunch, weekend brunch).
- 4
Parking restrictions, loading access and outdoor seating approvals with the relevant council.
- 5
Planning use class and any food-premises requirements before you pay for design.
- 6
Break-even covers at your ticket size — if rent needs heroic volume, renegotiate or walk.
- 7
Seasonal and weather sensitivity if the precinct is coastal or tourist-led.
- 8
Fit-out scope, landlord contribution and make-good obligations.
When Locatalyze can help
If you already have an address — or a shortlist of two or three — Locatalyze is built to stress-test the site before the lease becomes emotional. The report structures demand, competition, demographics and rent pressure for Australian café and hospitality formats. It does not replace legal advice or a valuation. It does replace guessing from Instagram queues. Start with a Perth café suburb overview, review a sample report, or analyse your address.
Considering opening a café in Perth? Analyse the proposed address before committing to the lease.
Free location score, map, data confidence and PROCEED / VERIFY / AVOID recommendation. Modelled financials stay optional.
Start a location reportRelated reading
Disclaimer
This article assesses publicly observable location and market indicators. It does not disclose or estimate any café’s actual private financial results. Business performance depends on rent, operating costs, management, product quality, pricing and many other factors. Figures from the ABS Census 2021 describe geographic areas, not individual tenancies. Always verify current leases, council rules and on-site trading patterns before signing.
Sources
Frequently asked questions
About the author
Locatalyze Research Team
Location intelligence, Locatalyze
The Locatalyze research team builds the location-scoring models behind the platform and writes up what the data shows for Australian operators.
Tools first — then a full report for your address
Free rent, viability, and break-even checks. Upgrade when you are ready for competitors, map, and numbers for a specific site.
No signup required for tools