Most cafe location decisions get made on instinct and a single visit. An operator walks a strip on a Saturday morning, watches the queue at someone else's counter, likes the light coming through the front window, and signs. The lease runs five years. The catchment, the rent ceiling, the competition that opens at 6am and the competition that opens at 6pm, the days the street empties out — none of that was measured. It was felt. This post is the opposite of that: what a structured forty-minute location analysis of a single real address — 100 william street perth — looks like, and the difference it makes to the decision.
The site is a ground-floor retail bay at 100 William Street, in the Perth CBD retail core, one block south of the Northbridge dining strip. It is a useful subject because it sits on top of a tension that most CBD sites carry and few operators price properly. On one side, a dense apartment catchment: the residential blocks immediately north are almost entirely high-rise units, which means thousands of potential daily regulars within a short walk. On the other, a major transit funnel, with Perth Station and Yagan Square a few hundred metres up the street feeding pedestrians past the door. Both of those are genuine assets. Sitting underneath them is the fact that the Perth CBD carries the highest retail vacancy of any capital-city centre in the country — 21.7 per cent in the first half of 2025 against a national CBD average of 11.1 per cent (CBRE, Australian CBD Retail Vacancy, H1 2025). A site can have real footfall and a real resident base and still sit in a market where one shopfront in five is dark.
The teardown that follows is a template as much as a verdict. It moves through seven questions in a fixed order — the catchment, the demographic match, the competition layer, the rent reality, the foot-traffic profile, the risks, and what would change the answer — because that order is reusable. You can run the same seven questions against any address on your own shortlist, and the closing section sets out exactly how. The numbers here are real and sourced; where a figure is a model output rather than an external measurement, it is labelled as one, and the two are kept apart throughout. The point is not to tell you whether to sign this particular lease. It is to show what signing it with your eyes open would actually require you to know.
One framing note before the verdict. The Locatalyze engine scores suburbs, not street numbers, and this post does not pretend otherwise. There is no precise machine score for the exact bay at 100 William Street, and inventing one would be dishonest. What there is, is a verified suburb-level score for the Perth CBD, a verified score for adjacent Northbridge, and a stack of verified inputs about the block itself. The verdict below is built from those.
100 William Street, Perth: the headline verdict (CAUTION)
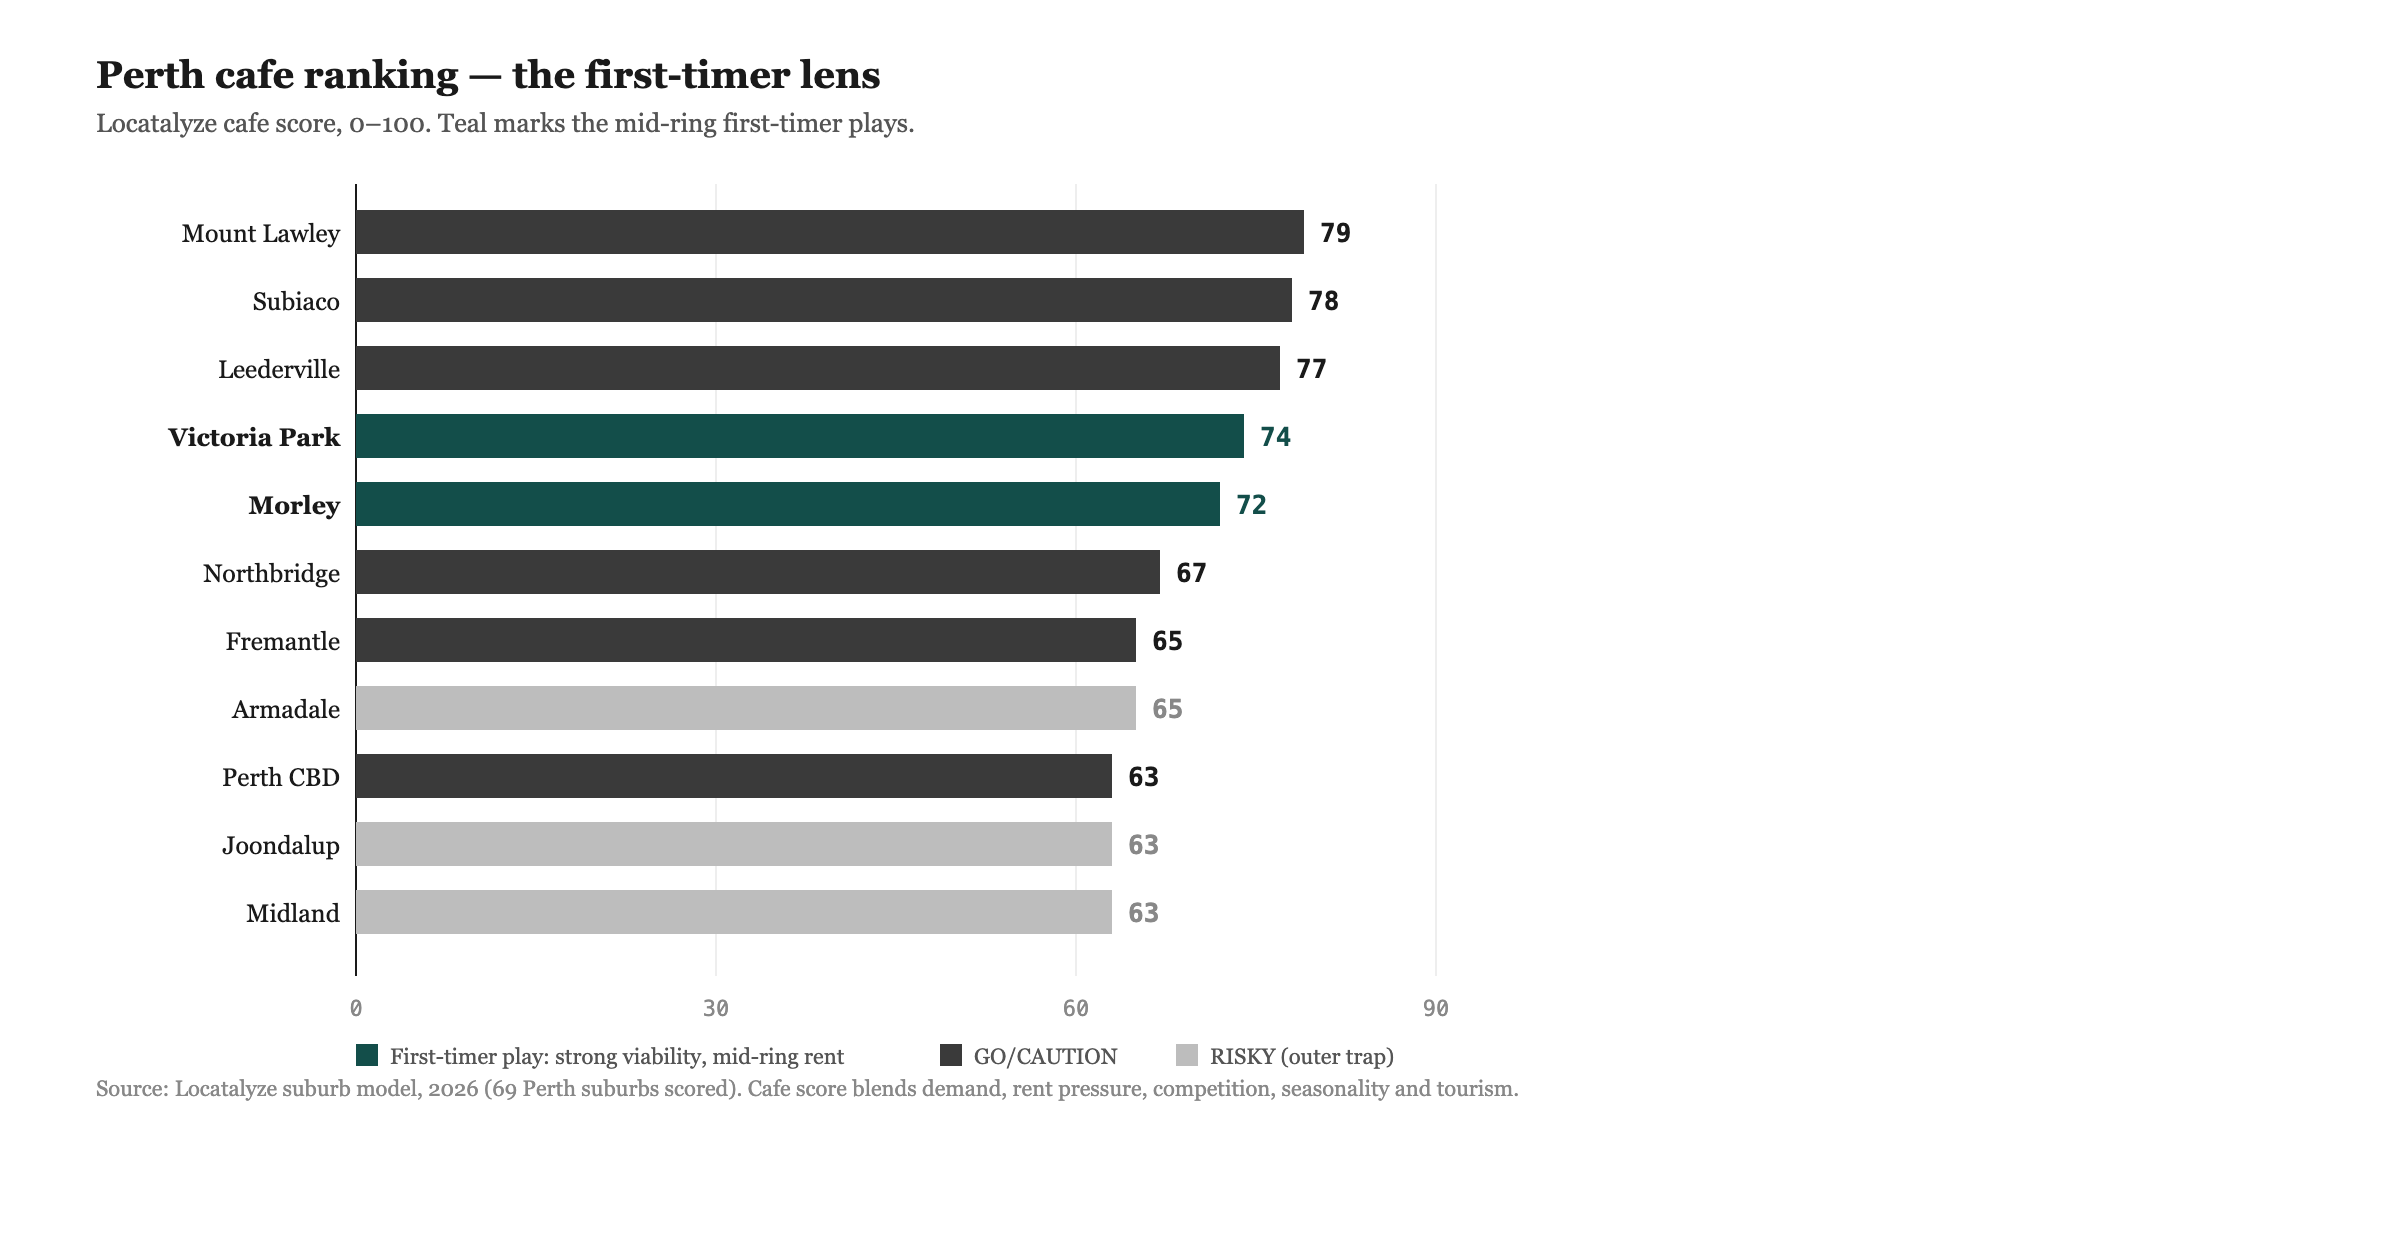
Treat this as a CAUTION, and read the word precisely. It is not a no. The Locatalyze suburb model scores the Perth CBD at 63 out of 100 for a cafe, with a CAUTION verdict, and adjacent Northbridge at 67, also CAUTION (Locatalyze suburb model, 2026). A bay at 100 William Street inherits the Perth CBD profile, because that is the suburb it formally sits in, with Northbridge as the precinct one block north. So the structured read on this address is CAUTION at the suburb level, and the analyst's read on the specific verified inputs — high resident density, strong transit footfall, dense incumbent competition, and a CBD with the worst retail vacancy in the country — lands in the same place.
Be clear about what kind of number that 63 is. It is a suburb-level score, not a per-door output, and no responsible analysis would print a fabricated figure for the exact tenancy. The honest version is the one the rest of this post argues: the verified inputs for this block describe a location that can work for a sharply specified cafe and will punish a vague one. CAUTION means the upside and the failure mode are both real and both large, and the gap between them is closed by the operator's choices, not by the address. The sections below are the evidence for that, taken one input at a time.
Section 1 — The catchment
A catchment, or trade area, is the geography a site actually draws customers from, and for a cafe it is small. Coffee is a walk-up, habit-driven purchase; the realistic daily trade area for a CBD cafe is the area a person will cross on foot without thinking about it, which in practice means a few hundred metres for the core and up to roughly a kilometre for the wider pull. The figure below frames that around 100 William Street as three concentric rings — 500 metres, 1 kilometre, 2 kilometres — with the landmarks that define each.

Catchment map of 100 william street perth with 500m, 1km and 2km walking trade-area rings, marking Perth Station and Yagan Square to the north, the Northbridge dining strip, the Perth Cultural Centre, and the Murray and Hay Street malls to the south.
The geometry matters because the four sides of this catchment are not the same kind of demand. To the north, within and just beyond the 500-metre ring, sit Perth Station and Yagan Square, the city's main rail interchange and a public-space node that together act as a pedestrian funnel — commuters and visitors moving through, not necessarily stopping (Visit Perth, Yagan Square). Further north, the Northbridge dining strip runs along William Street as a dense food, coffee and night-time-economy precinct (Destination Perth). To the north-west, the Perth Cultural Centre anchors a cluster of the WA Museum, the Art Gallery of WA and PICA, which pulls a different, more episodic crowd. To the south sits the CBD retail core — the Murray Street and Hay Street pedestrian malls — which brings daytime worker and shopper traffic but goes quiet after hours.
The reason a cafe operator should care about the shape rather than just the size is that each side peaks at a different time. The station funnel peaks at the morning and evening commuter dayparts. The malls peak at weekday lunch. Northbridge peaks at night and at weekend brunch. The Cultural Centre peaks around exhibitions and events. A site that sits at the meeting point of four mismatched peaks can be busy at a different hour every day and still never build the steady regular base a cafe needs, unless the operator picks one of those peaks and builds the offer around it. Catchment size is the easy question. Catchment *timing* is the one that decides whether the trade compounds into regulars or just churns. The broader logic of why a trade area's shape and travel behaviour matter more than a headline population count is something we have set out separately in our work on customer catchment area and travel distance.
Section 2 — The demographic match
A catchment is only worth having if the people in it are the people a cafe sells to. Here the residential side of the picture is unusually strong, and it is worth using two ABS geographies rather than one, because they describe two different things.
The formal geography is the Perth City SA2 — the large inner-Perth statistical area that 100 William Street sits inside. At the 2021 Census it held a population of 110,530, a median age of 36, and a median weekly household income of $2,093 (ABS, 2021 Census, Perth City SA2). Crucially for a cafe, 46.2 per cent of its occupied private dwellings are flats or apartments, and 67,205 residents are in the labour force — a working, apartment-dwelling, middle-aged population, which is close to the demographic centre of gravity for daily coffee spend.
The finer-grain residential geography is the Perth (West) – Northbridge SA2, the apartment core immediately north of the site, and it sharpens the read. At the 2021 Census it held 12,119 residents, a median age of 34, and a median weekly household income of $1,966, with a dwelling mix that is roughly 98 per cent apartments and units — near-zero detached housing (ABS, 2021 Census, Perth (West) – Northbridge SA2). That is about as dense and as residential as Australian inner-city stock gets. A cafe on this block is not relying solely on commuters passing through; it has a standing population of apartment dwellers a few minutes' walk away, the cohort most likely to treat a nearby cafe as an extension of a kitchen they do not have much of.
The match, then, is good on paper. The resident catchment is dense, young-ish, employed and apartment-bound, which is the profile cafes do best against. Two cautions sit underneath that. First, density is not loyalty; a high-rise resident has a dozen cafes within the same short walk, so the catchment supports a cafe but does not protect any particular one. Second, the daytime population is dominated by office and transit flows that are far larger than the resident base but far less loyal — they will buy a coffee from whoever is closest to their path, which is a footfall story, not a demographic one, and we come back to it in Section 5. The demographic verdict is a clear positive, with the asterisk that it raises the ceiling without lifting the floor.
Section 3 — The competition layer
This is the section where honesty about method matters most, so it comes with a guardrail. We did not verify a precise count of cafes within 500 metres, 1 kilometre or 2 kilometres of the bay, and so we do not print one. Fabricating competitor counts is exactly the kind of false precision that makes a site analysis worse than useless. What can be established from sourced material is the *structure* of the competition, and the structure is enough to reason from.

Competition density and vacancy panel for 100 william street perth, contrasting dense incumbent food competition in the 500m ring against Perth CBD retail vacancy of 21.7 per cent versus the 11.1 per cent national CBD average.
The establishable picture is this. One block north, the Northbridge strip along William Street is a dense, named dining and coffee precinct — Destination Perth describes it as a hub for "great coffee and brunch options," affordable Asian cuisine, South American barbecue and a run of wine bars and pubs (Destination Perth, Northbridge). That is a wall of incumbent food and beverage competition sitting directly between this site and the busiest part of the precinct. To the south, the CBD retail core brings the chain coffee operators and mall food tenancies that cluster around department stores and worker flows. So the 500-metre ring is best characterised as dense and contested for the same dayparts a cafe would chase, and the 1-kilometre ring widens that into the full Northbridge night-time economy on one side and CBD-mall food retail on the other.
Two method points follow. First, the relevant question is not how many cafes exist but how many compete for *your* daypart. A brunch-led cafe competes with the Northbridge brunch trade; a commuter-grab-and-go competes with the chains near the station; an evening operator competes with bars, not cafes. Counting all food businesses in a radius overstates competition for any single, well-specified offer and understates it for a vague one. Second, the rule we hold to elsewhere applies here: do not assert "high competition" without evidence of the competitors, and do not assert empty white space without it either. The defensible statement is that this is a dense, multi-daypart competitive environment in which differentiation by daypart and offer is the thing that decides survival, and the precise count is a question the on-the-ground analysis answers, not the desk one.
Section 4 — The rent reality
This is where the site's headline tension becomes a number. The Perth CBD carried a retail vacancy rate of 21.7 per cent in the first half of 2025 — the highest of any Australian CBD, against a national weighted CBD average of 11.1 per cent (CBRE, Australian CBD Retail Vacancy, H1 2025). Read that figure carefully, because it cuts both ways. A vacancy rate that high is a demand warning: it means a large share of Perth CBD shopfronts could not hold a paying tenant, and a cafe is a retail tenant. It is also, for a tenant with options, a negotiating asset — in a market with that much empty space, a landlord has a weaker hand on rent, fit-out contribution and rent-free periods than the headline asking rent implies. The same number that should slow you down should also make you negotiate harder.
On the rent itself, we hold to what is verified and refuse to invent the rest. No third-party prime-retail figure in dollars per square metre for this block was opened and confirmed, so this post states none — quoting a $/sqm rate we could not source would be the same false precision the competition section refused. What can be stated is the Locatalyze model band: high-volume Perth CBD and Northbridge street retail sits in the platform's top tier at $4,000 to $15,000 a month (Locatalyze suburb model, 2026). That is a wide band, and the width is the point — it spans a small inline bay and a prime corner, and where a specific tenancy lands inside it is the single most important number an operator needs to pin down before signing.
The discipline that turns a rent figure into a decision is occupancy cost — rent plus outgoings as a share of forecast turnover. A cafe that holds occupancy cost in a sustainable band can absorb a high CBD rent; one that signs a rent its turnover cannot carry fails regardless of how good the coffee is. The model itself bears this out at scale: across the suburbs where we hold factor-level data, rent pressure is the single strongest predictor of a cafe location score, stronger than demand, and the prestige addresses where rent pressure runs highest are where cafe scores fall — the finding we set out in full in our cafe success factors Australia study. That study says what works generally; this teardown says what it means on this block. On 100 William Street, the message is consistent. The rent band is the high-volume tier, the vacancy data says the landlord's position is weaker than the asking rate suggests, and the operator who treats the lease as a negotiation rather than a fixed price has the better odds. For the broader method of converting a rent quote into a defensible per-square-metre benchmark, our guide to commercial rent per square metre in Australia sets out the workings.
Section 5 — The foot-traffic profile
Footfall is the asset this address is sold on, and it is also the one most often misread, so this section is deliberately careful about what is verified and what is not. There is no verified pedestrian count for the William Street 100 block — no turnstile number, no published daily count — and this post does not invent one. What is verified is the *infrastructure* that generates footfall, and it is strong.
The site sits inside Perth's Free Transit Zone, the area within the City of Perth where Transperth buses travel free, which removes a friction from short hops into and around the block (Transperth, CAT and Free Transit Zone). The free Green CAT bus stops on William Street, and the broader CAT network circles the CBD, with Yagan Square served by the Yellow and Red routes. Perth Station and Yagan Square sit a few hundred metres north, and the William and Murray corner sits above Perth Underground station — so the block is wrapped in transit on three sides. The qualitative read is unambiguous: this is a high-throughput pedestrian environment, fed by rail, free buses and the station funnel.
The caution is what that throughput converts to. High footfall is raw flow, not sales, and the gap between the two is where a lot of high-rent retail dies. A commuter funnelling from the station to an office at 8:15am is footfall, but they convert only if the cafe is on their exact path, fast, and visible — a site fifty metres off the desire line captures almost none of them. We have written separately on why high foot traffic does not guarantee sales, and a transit-funnel CBD site is the textbook case: the flow is real, but it is directional, time-compressed and indifferent. The practical reading for 100 William Street is that the footfall asset is genuine and the conversion question is the whole game. An operator who can name which flow they are capturing — the morning commuter, the lunchtime worker, the apartment-dweller's weekend — and who positions the door, the speed of service and the offer to that flow, turns the footfall into trade. An operator who simply assumes "lots of people walk past" will pay a high-volume rent for a low-conversion result.
Section 6 — The risks
Pulling the inputs together, four risks define this site, and naming them is the point of the exercise.
The first is the CBD vacancy signal. A 21.7 per cent retail vacancy rate is not a neutral fact; it is the highest in the country and it tells you that a large share of nearby tenancies could not sustain a business (CBRE, H1 2025). Some of that is structural — post-pandemic office attendance, the slow reweighting of CBD retail toward food and experience — but a cafe is not immune to the conditions that emptied those shopfronts. The site is in a market that is recovering, not a market that has recovered.
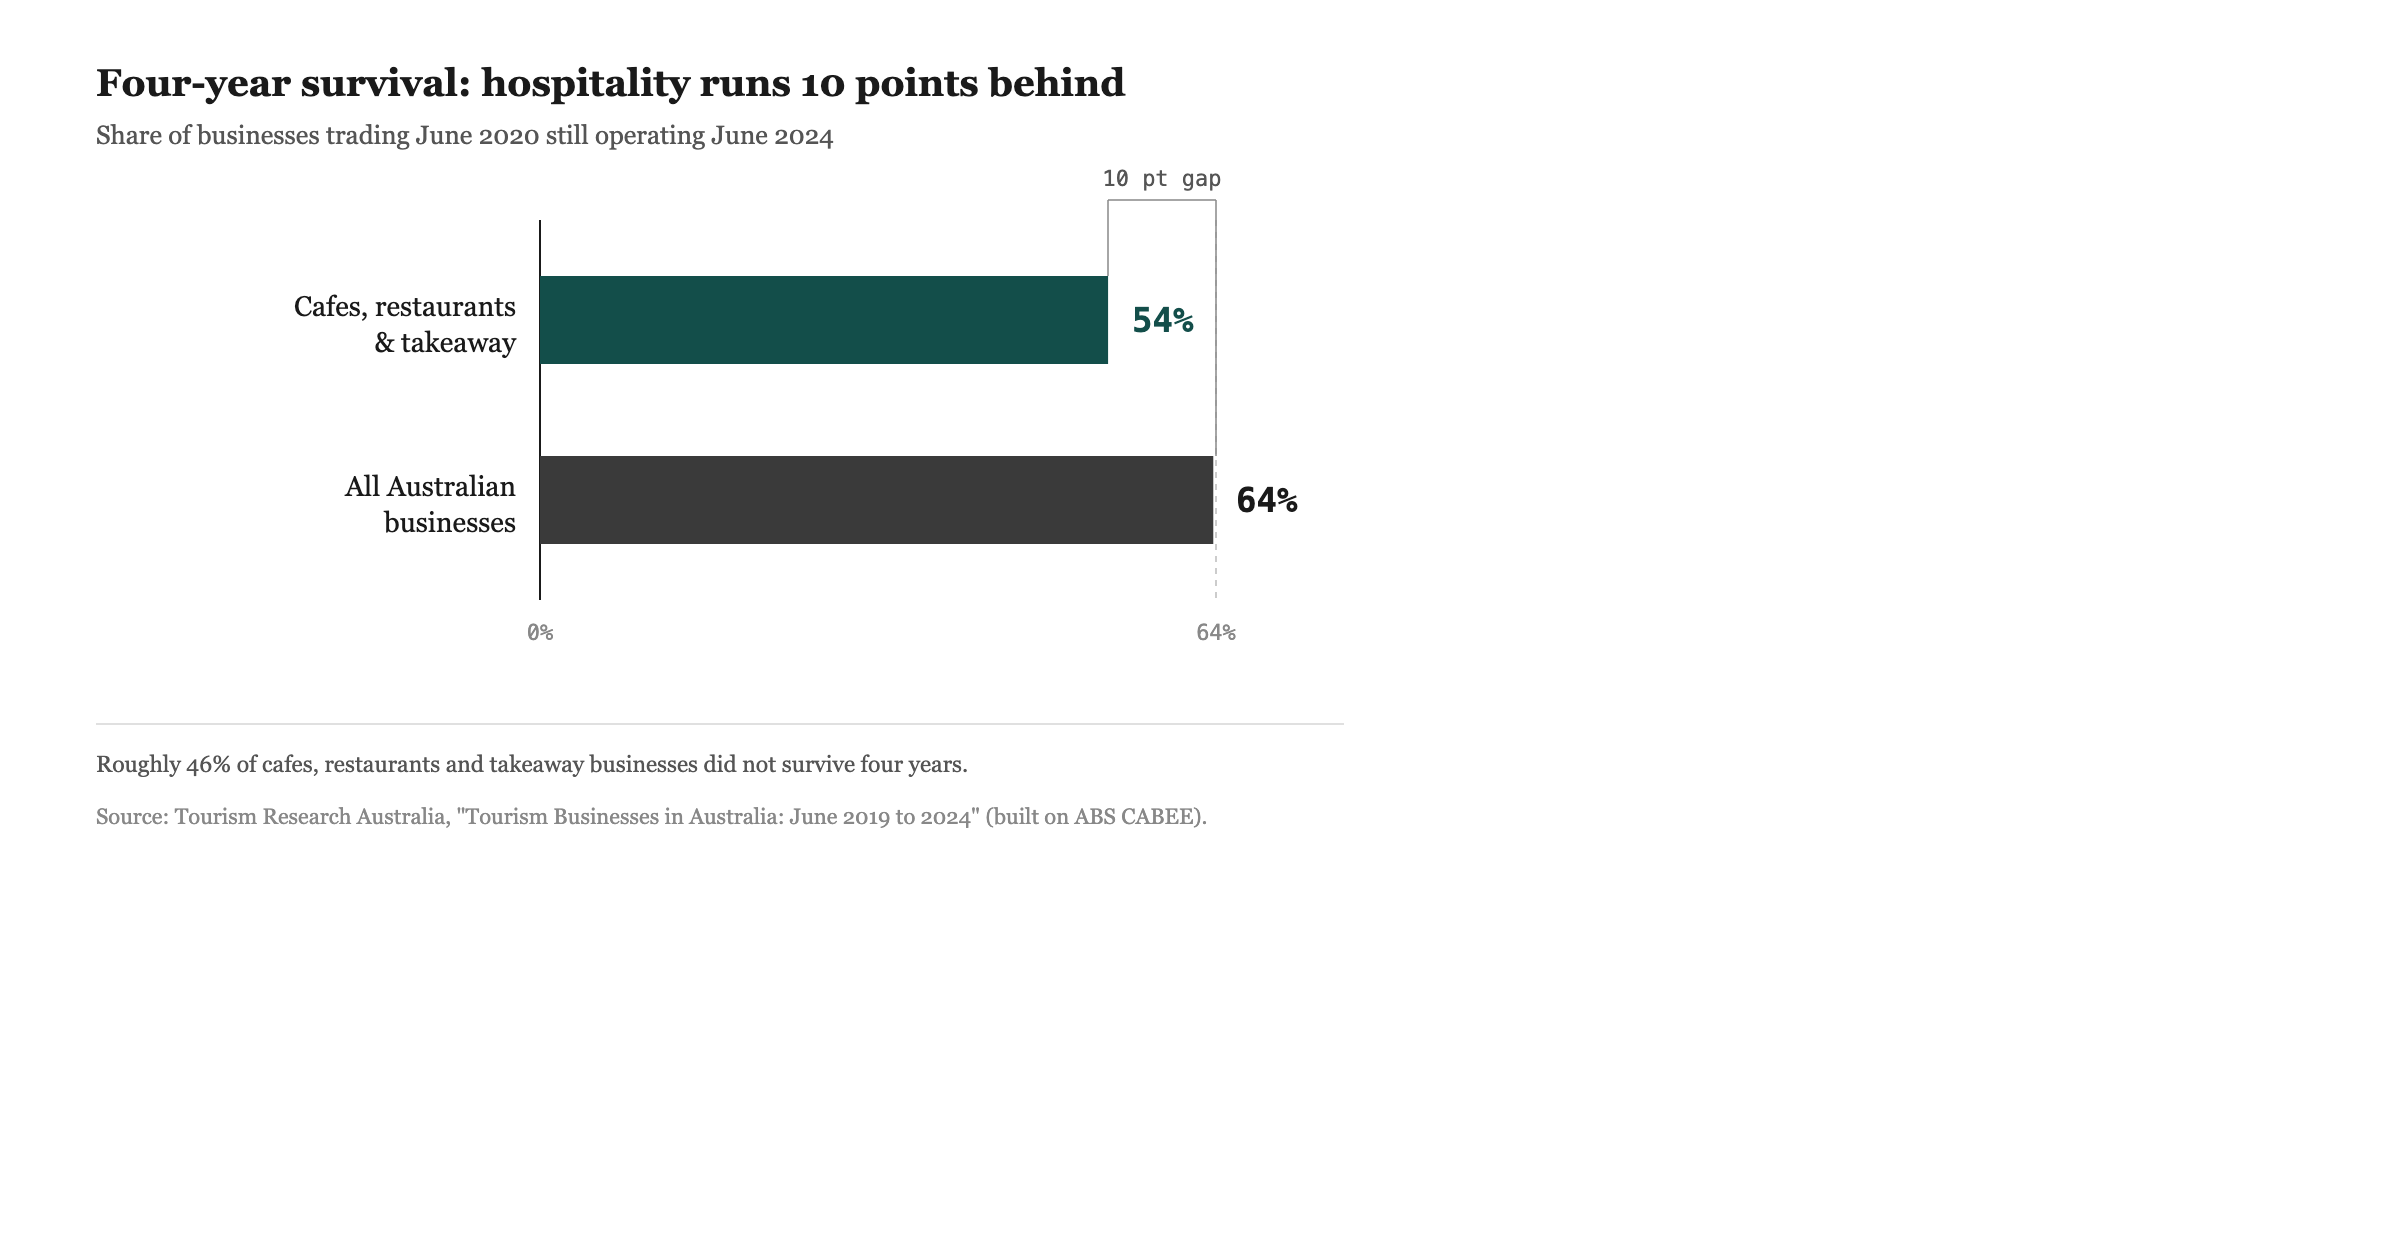
The second is base-rate failure. This is a cafe, and Australian cafes fail at a high rate independent of any single address. Accommodation and Food Services was the second-largest source of company insolvencies in FY2023-24, around 15 per cent of the national total, roughly 1,667 companies (ASIC, insolvency data, FY2023-24). Cafe and restaurant businesses show about a 54 per cent four-year survival rate against roughly 64 per cent for all businesses (TRA / ABS). Before the site adds or subtracts anything, the prior on a new cafe is closer to a coin-flip over four years than to a safe bet, and a high-rent CBD location raises the stakes on that prior rather than lowering it.
The third is competitive density without differentiation. The Northbridge strip one block north is a wall of established coffee and food operators with incumbency, fit-outs already paid down, and existing regulars (Destination Perth). A new entrant that offers the same brunch to the same crowd is competing from behind on every variable that matters. The risk is not that competition exists; it is entering it undifferentiated.
The fourth is footfall conversion. The transit funnel delivers volume, but a site that misreads directional commuter flow as captive demand will carry a high-volume rent against a fraction of the throughput it counted on. The risk lives in the gap between people-passing and people-buying.
None of these is disqualifying on its own. Together they explain why the verdict is CAUTION rather than GO: this is a location where the failure modes are specific, large, and avoidable — which is a very different thing from a location where they are small.
Section 7 — What would change the verdict
A CAUTION is a conditional, and the conditions are nameable. Several concrete facts, if established, would move this site toward GO; several others would push it toward NO. Setting them out is what separates a verdict from an opinion.
Toward GO. A confirmed rent at the lower end of the $4,000 to $15,000 band, secured with landlord fit-out contribution and a rent-free fit-out period — entirely plausible given 21.7 per cent vacancy and the weaker landlord hand it implies — would change the occupancy-cost maths materially. A door positioned directly on a verified commuter desire line between the station and a major office cluster, rather than off it, would convert the footfall asset. A sharply specified offer aimed at one daypart and one flow — fast morning trade for commuters, or a weekend brunch destination for the apartment core, but not a vague all-things cafe — would lift conversion and reduce head-on competition with the Northbridge incumbents. And evidence of under-served demand on the block specifically, rather than assumed demand, would confirm the catchment supports another entrant.
Toward NO. A rent at the top of the band without fit-out support would likely push occupancy cost past what the achievable turnover can carry. A site set back from the main pedestrian desire lines would strand the footfall advantage. An undifferentiated brunch concept dropped into the densest brunch competition in the city would compete from behind. And a worsening rather than improving CBD vacancy trend — the 21.7 per cent figure rising again — would signal that the recovery the H1 2025 number hints at has stalled.
The verdict is genuinely conditional, and the conditions are mostly about the lease terms and the concept, not the address. That is the useful conclusion: 100 William Street is a location where the operator's decisions, not the postcode, decide the outcome.
How 100 William Street compares
A verdict reads better against alternatives. The table below sets the subject bay beside three nearby Perth cafe locations on the same metrics, drawing the cafe scores from the suburb model. It is the same comparison rendered as a figure for those who prefer it.

Comparison table for 100 william street perth against Northbridge, Leederville and Mount Lawley addresses on cafe score, catchment density, rent band, transit footfall and competition daypart.
The pattern is instructive. Leederville and Mount Lawley score GO at 77 and 79 not because their demographics beat the CBD's — the CBD's apartment density is higher — but because they sit a rent tier lower, in the inner-premium band rather than the high-volume one, with calmer single-daypart competition (Locatalyze suburb model, 2026). The CBD's higher footfall and denser catchment are real advantages, and they are offset by a higher rent ceiling and a more contested, multi-daypart competitive field. That trade — more flow and more density, against more rent and more competition — is precisely the CBD cafe bargain, and it is why a CBD site demands a sharper operator than a cafe-strip site does. If you are choosing a Perth cafe location for a first venture, the suburbs that score GO are usually the lower-variance starting point, which is the argument we make in our guide to the best Perth suburbs for a first-time cafe.
How this analysis was built — and how to run it on your own shortlist
The teardown above took the verified inputs in a fixed order: the address and what it physically is, the catchment shape and timing, the demographic match from two ABS geographies, the competition structure, the rent and vacancy reality, the footfall infrastructure and its conversion risk, the named risks, and the conditions that would move the verdict. Every external figure is sourced, every model figure is labelled, and where a number could not be verified — a competitor count, a $/sqm rent, a pedestrian tally — it was left out rather than invented.
That structured comparison is what the Locatalyze platform automates. You can see the live Perth coverage, suburb by suburb, on the Perth analysis page, and the same engine runs across every city we cover from the main analysis page.
When you are ready to test a specific address rather than a suburb, run your shortlist through the same analysis — enter the business type, the address and the rent, and the platform produces the catchment, competition, rent and verdict layers this post worked through by hand. Forty minutes of analysis is the cheapest forty minutes of a five-year lease.
Analyse your address →References
CBRE, *Australian CBD Retail Vacancy, H1 2025*. Perth CBD retail vacancy 21.7% in H1 2025, the highest of any Australian CBD and the lowest Perth CBD figure since H1 2021; national weighted CBD retail vacancy 11.1%, attributed to CBRE Head of Retail Research Kate Bailey.
ABS, *2021 Census All persons QuickStats*, Perth City SA2 (code 50302): population 110,530; median age 36; median weekly household income $2,093; flats/apartments 46.2% of occupied private dwellings; 67,205 people in the labour force.
ABS, *2021 Census*, Perth (West) – Northbridge SA2 (code 503021297): population 12,119; median age 34; median weekly household income $1,966; dwelling stock about 98% apartments. Census figures only; later third-party projections excluded.
Visit Perth, *Yagan Square* and *Buses and trains*. Yagan Square sits adjacent to Perth Station between Roe and Wellington Streets, a few hundred metres north of the 100 block.
Destination Perth, *Northbridge*. Cultural and dining hub extending north along William Street, with coffee, brunch, Asian and South American cuisine and wine bars; houses the Perth Cultural Centre (WA Museum, Art Gallery of WA, State Theatre, PICA).
Transperth, *CAT timetables* and Free Transit Zone. Free Central Area Transit buses circle the CBD; the Green CAT stops on William Street; the Free Transit Zone covers Transperth bus travel within the City of Perth boundary, which includes the 100 block.
ASIC, *Australian insolvency statistics*, FY2023-24. Accommodation & Food Services the second-largest source of company insolvencies, ~15% of the national total (~1,667 companies).
Tourism Research Australia, analysis of ABS Counts of Australian Businesses (CABEE). Cafe/restaurant four-year survival ~54% versus ~64% for all businesses.
About the author
Locatalyze Research Team
Location intelligence, Locatalyze
The Locatalyze research team builds the location-scoring models behind the platform and writes up what the data shows for Australian operators.
Tools first — then a full report for your address
Free rent, viability, and break-even checks. Upgrade when you are ready for competitors, map, and numbers for a specific site.
No signup required for tools