Of every 100 cafes, restaurants and takeaway businesses trading in June 2020, 54 were still trading four years later. Across the whole Australian economy, the figure was 64. That ten-point gap is the entire story, and almost nobody quotes it. They quote a scarier, rounder number instead, one that nobody can source.
Here is the part that should bother any operator about to sign a lease: hospitality posted one of the lowest survival rates of any category in that period, yet the sector's turnover reached $66.273 billion in FY25, up 2.5% year on year (ABS Retail Trade, via Restaurant & Catering Australia, August 2025). The pie got bigger while the failure rate hit records. Both things are true at once, and the reason they are both true is geography.
That is the thesis. The cafe failure rate in Australia is not random, not mostly about the coffee, and not a fixed law of the universe. It is largely predictable from the lease — from walk-past traffic, from the rent-to-revenue ratio the site forces on you, and from competition density inside your catchment. Cafes do not usually fail because the flat white was mediocre. They fail because the site could never carry the rent at the volume the location could realistically deliver, and that was knowable before the keys changed hands. The popular "60 to 70% of cafes fail" line obscures this. It tells you the game is a coin toss, when in fact a large share of failures are sites that never pencilled out.

Figure 1. Four-year business survival, June 2020 to June 2024. Cafes, restaurants and takeaway run roughly ten points behind the all-business average. Source: Tourism Research Australia, built on ABS CABEE.
The cafe failure rate Australia keeps quoting, sourced honestly
Start with the number you have heard at every industry night. "Sixty, seventy percent of cafes fail." Sometimes it climbs to ninety. Ask where it comes from and the room goes quiet, because it comes from nowhere checkable. The "90% fail in year one" claim traces back to an unsourced American television advertisement from the early 2000s — a marketing line, not a study, repeated until it acquired the texture of fact. When researchers actually measure first-year restaurant failure with proper data, the figure lands nearer 14 to 30%. Real, painful, but not apocalyptic.
So what is the honest number? The cleanest one available comes from survival tracking. Of hospitality businesses operating in June 2020, 54% were still operating in June 2024 (Tourism Research Australia, *June 2019 to 2024*). Invert it: roughly 46% did not survive four years. That is the figure to carry around. Not 70% in eighteen months — about 46% over four years, against 36% for the broader economy.
The distinction matters for how you plan. A 70%-in-18-months belief tells you to grab cash fast and expect to lose. A 46%-over-four-years reality tells you that the first year and a half is a filter, not a death sentence, and that the businesses clearing the filter are disproportionately the ones on the right sites. The eighteen-month window is where under-traded locations run out of runway, because that is roughly how long a thinly capitalised cafe can absorb the gap between the rent it signed and the revenue the footpath actually delivers.
Failure also is not evenly spread. Accommodation and Food Services was the second-largest source of corporate insolvency in FY24 — 1,667 companies, 15% of all external administrations, behind only Construction at 27% (ASIC, *Annual insolvency data*, FY2023–24, 25 July 2024). For a sector that is a sliver of GDP to sit second on that table tells you the base rate of distress is structurally high. And it got worse fast. More than 11,000 companies entered external administration in FY24, up 39% year on year (ASIC, FY2023–24). Hospitality insolvencies specifically rose 57% in the twelve months to March 2025, 1,837 against 1,168 the year before (ASIC data, reported April 2025).
CreditorWatch put a sharper edge on it. In the twelve months to 31 January 2025, 9.2% of Food and Beverage Services businesses failed — a record high, counting insolvency, voluntary closure and ASIC strike-off together. Their read on the drivers was rent, wages, insurance, interest rates and food prices (CreditorWatch Business Risk Index, 20 February 2025). Read that list again. Two of those five — rent, and the interest rates that move your fitout debt — are decided the day you choose the site. Wages scale with the volume the site can support. The location is doing most of the work before you have pulled a single shot.
Why eighteen months, and why the site decides it
The eighteen-month wall is not folklore. It is the cash-flow arithmetic of a fitout running out.
A new cafe spends heavily before it earns: fitout, equipment, bond, the first months of rent and wages while the site builds a base of regulars. That spend is sunk. The only thing keeping the doors open afterwards is whether weekly trade covers weekly costs with enough left to repay the setup. If the site over-trades on a thin margin, the buffer lasts. If it under-trades, the owner funds the gap out of savings, then a loan, then supplier credit — and somewhere around month twelve to eighteen the funding sources run dry at roughly the same time. That convergence is the wall.
Notice what is doing the killing. It is not a sudden event. It is a structural shortfall between the revenue a location can produce and the cost base the lease locks in, compounding quietly from day one. Which is exactly why so much of the failure is predictable. You can estimate both sides of that equation before signing.
Walk-past traffic sets the revenue ceiling. A cafe converts a fraction of the people who physically pass the door — a small fraction, and a fairly stable one for a given format and price point. Double the walk-past and you roughly double the realistic revenue ceiling, holding ticket size constant. This is why two cafes with identical menus, identical baristas and identical fitouts, one on a station-adjacent corner and one ninety metres up a side street, are not the same business. They have different revenue ceilings, set by the footpath, and no amount of operating excellence closes a gap that large. We have written separately on how pedestrian-count data translates into realistic trade estimates, because this is the single most under-measured input in the whole decision.
Rent-to-revenue is the cost-side mirror. Treat it as a framework, not a sourced benchmark, because no honest single figure exists across formats and cities. The arithmetic is unforgiving regardless. If gross effective rent — base rent plus outgoings, net of any incentive amortised over the term — lands at 10% of revenue, a cafe has room to breathe. If the realistic revenue the footfall supports pushes that same rent to 18 or 20% of turnover, the business is structurally short before it opens, because food, labour and the rest of the cost stack do not compress to make space. The dangerous move is signing the rent first and hoping the revenue rises to justify it. Revenue is capped by the footpath; rent is fixed by the lease. When operators say a site "didn't work," this ratio is usually what didn't work.
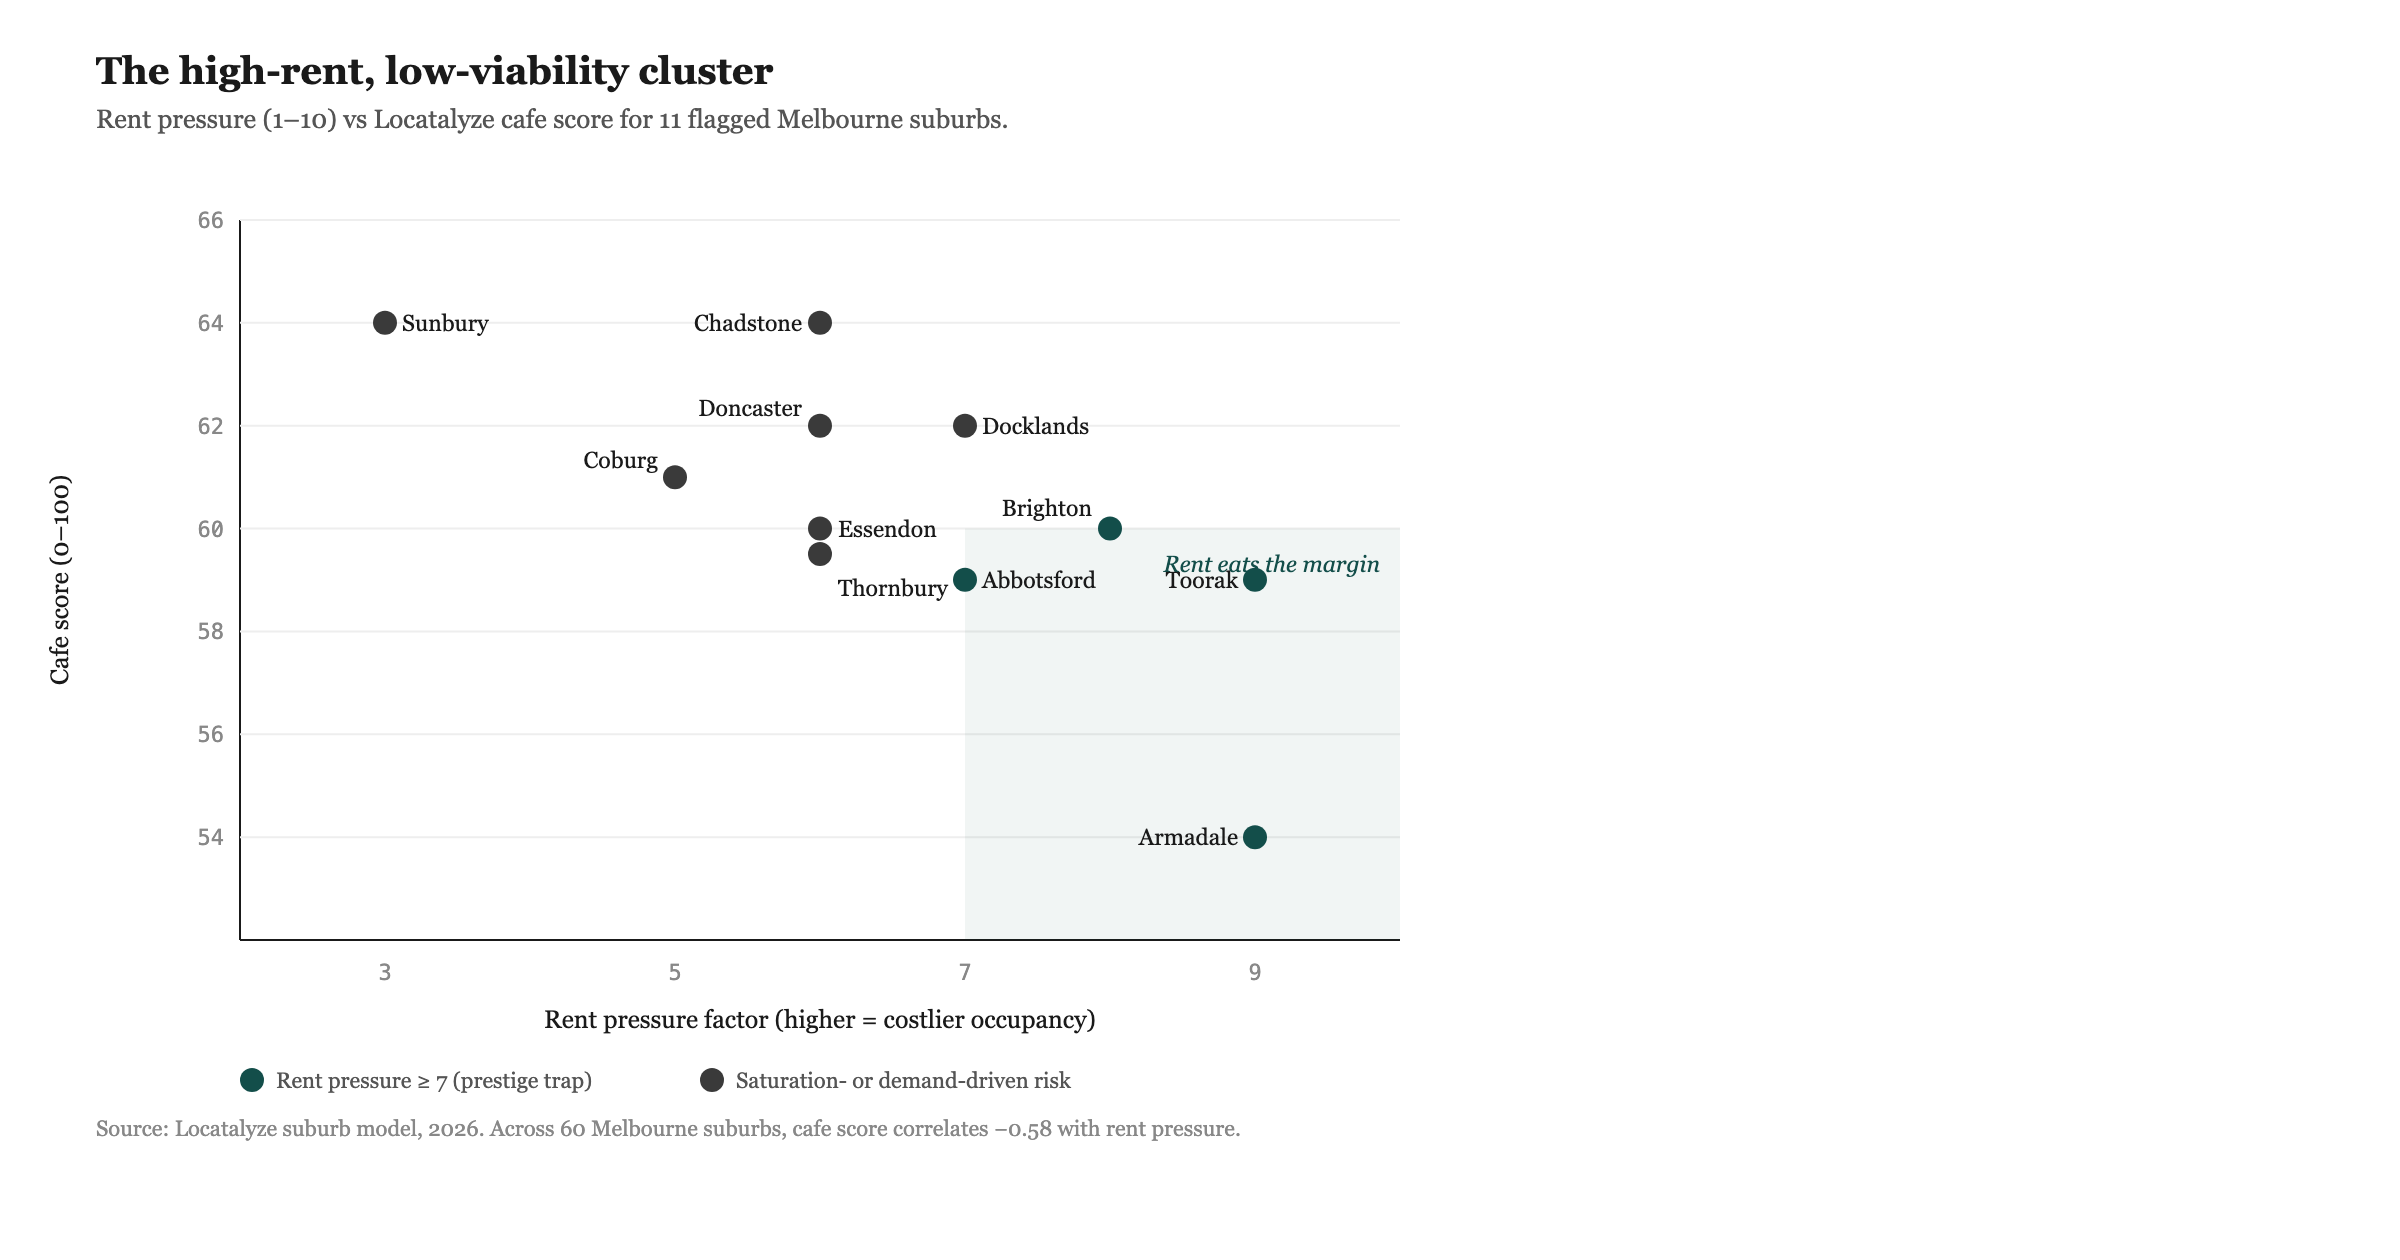
Competition density is the third lever, and the one most often misjudged. A dense cluster of cafes is not automatically bad — clusters can build a destination catchment that lifts everyone. The failure pattern shows up when density is high *and* the catchment is shallow: too many seats chasing the same finite walk-past, so each operator trades below the volume their rent assumes. Counting competitors is not enough. You have to weigh them against the catchment that feeds them, which is a different exercise from drawing a circle on a map — the distinction between a true catchment and a naive trade-area radius is where a lot of site decisions quietly go wrong.
A framework for reading a site before you sign
Here is a comparison I use when walking a prospective site. It is an analyst's framework built from the failure logic above, not a table of surveyed statistics. The survival figures are sourced; the row-by-row site characteristics are deliberately presented as the *pattern* that separates sites that carry their rent from sites that do not. Treat the cells as diagnostic prompts, not measurements.
To make the cities concrete, the same framework reads differently depending on where you are leasing — which is the whole reason we publish city-specific analysis for Sydney, Melbourne and Brisbane. A Melbourne laneway and a Brisbane suburban strip impose different walk-past profiles, different incentive structures and different competition densities, and a framework that ignores that local texture is just a horoscope.
None of those city cells is a published statistic. They are the questions to ask, framed by city, so the answers you gather mean something. The arithmetic underneath is identical everywhere: revenue ceiling set by feet, cost floor set by the lease, survival decided by the gap.
A worked example using the sector's real numbers
Run the only honest kind of example — one built from verified sector figures, not invented from a specific cafe's books.
Take the survival data at face value. A cohort of hospitality sites opens. Over four years, about 46% will close (the inverse of the 54% survival rate; Tourism Research Australia, *June 2019 to 2024*). Now layer on what the insolvency data says about *when* and *why*. With Accommodation and Food Services sitting second on the FY24 insolvency table at 15% of all external administrations (ASIC, FY2023–24), and food-and-beverage failures hitting a record 9.2% in the year to January 2025 (CreditorWatch, February 2025), the closures are not spread evenly across the four years. They cluster early, in the eighteen-month window where capitalisation runs out, and they cluster on sites carrying cost bases their locations could not support.
Hold that against the turnover line. Sector revenue hit $66.273 billion in FY25, up 2.5% (ABS Retail Trade, via Restaurant & Catering Australia, August 2025). Demand for coffee and meals out is not collapsing — it is growing. So the record failure rate is not a demand story. It is a distribution story. The aggregate dollars are real; they simply are not landing evenly across sites. The well-located cafe captures a rising share of a growing pool. The poorly located one starves inside the same growing market, because its share of the footpath is too thin to convert the macro tailwind into trade.
That is the worked lesson, and it is more useful than any invented profit-and-loss. When the market grows and failures still hit records simultaneously, the variable separating winners from losers cannot be the market. It has to be the site. The macro environment that CreditorWatch flagged — rents, wages, insurance, rates, food costs (CreditorWatch, February 2025) — squeezes everyone equally. What it does *not* do equally is push you under. The site decides who gets pushed, because the site decides how much revenue you have to absorb the squeeze with.
What the broader exit data does and does not tell you
A caution on the headline economy-wide figures, because they get misread constantly.
The national business exit rate was 13.9% in 2024–25: 370,500 exits against 437,150 entries, from a base of 2,729,648 businesses trading at 30 June 2025 (ABS, *Counts of Australian Businesses*, released 16 December 2025). It is tempting to read 13.9% as "a 14% failure rate." Resist it. An exit in that dataset includes businesses that closed solvent, were sold, merged, or simply ceased an ABN — not only failures. More businesses entered than exited, so the population grew. Exit is not the same as failure, and conflating them either flatters or frightens depending on which way you are spinning.
The survival figures are cleaner for our purposes, because they track the same cohort over time rather than netting flows in a single year. That is why the 54% survival number (Tourism Research Australia, *June 2019 to 2024*) carries more weight here than the 13.9% exit rate. It answers the operator's actual question — *will the business I open still be open in four years* — rather than the macro question of how the business count churns.
What this analysis does not cover
This is a location and survival argument, and it has hard limits worth stating plainly.
It does not cover operator quality. A well-located cafe run badly still fails, and the data here cannot isolate management skill, food quality, service or brand from the site. The claim is narrower: site quality sets the ceiling and the floor, and within that band, execution decides where you land. A great site does not guarantee survival; it makes survival reachable. A poor one can make it nearly impossible regardless of how good the operator is.
It does not cover capital structure, which the figures above only gesture at. Two identical sites with different debt loads, lease terms or owner cash reserves have different survival odds, and none of the cited sources break failure down by capitalisation. The eighteen-month wall is a generalisation; a well-funded operator can push it out, and an over-geared one can hit it at month nine.
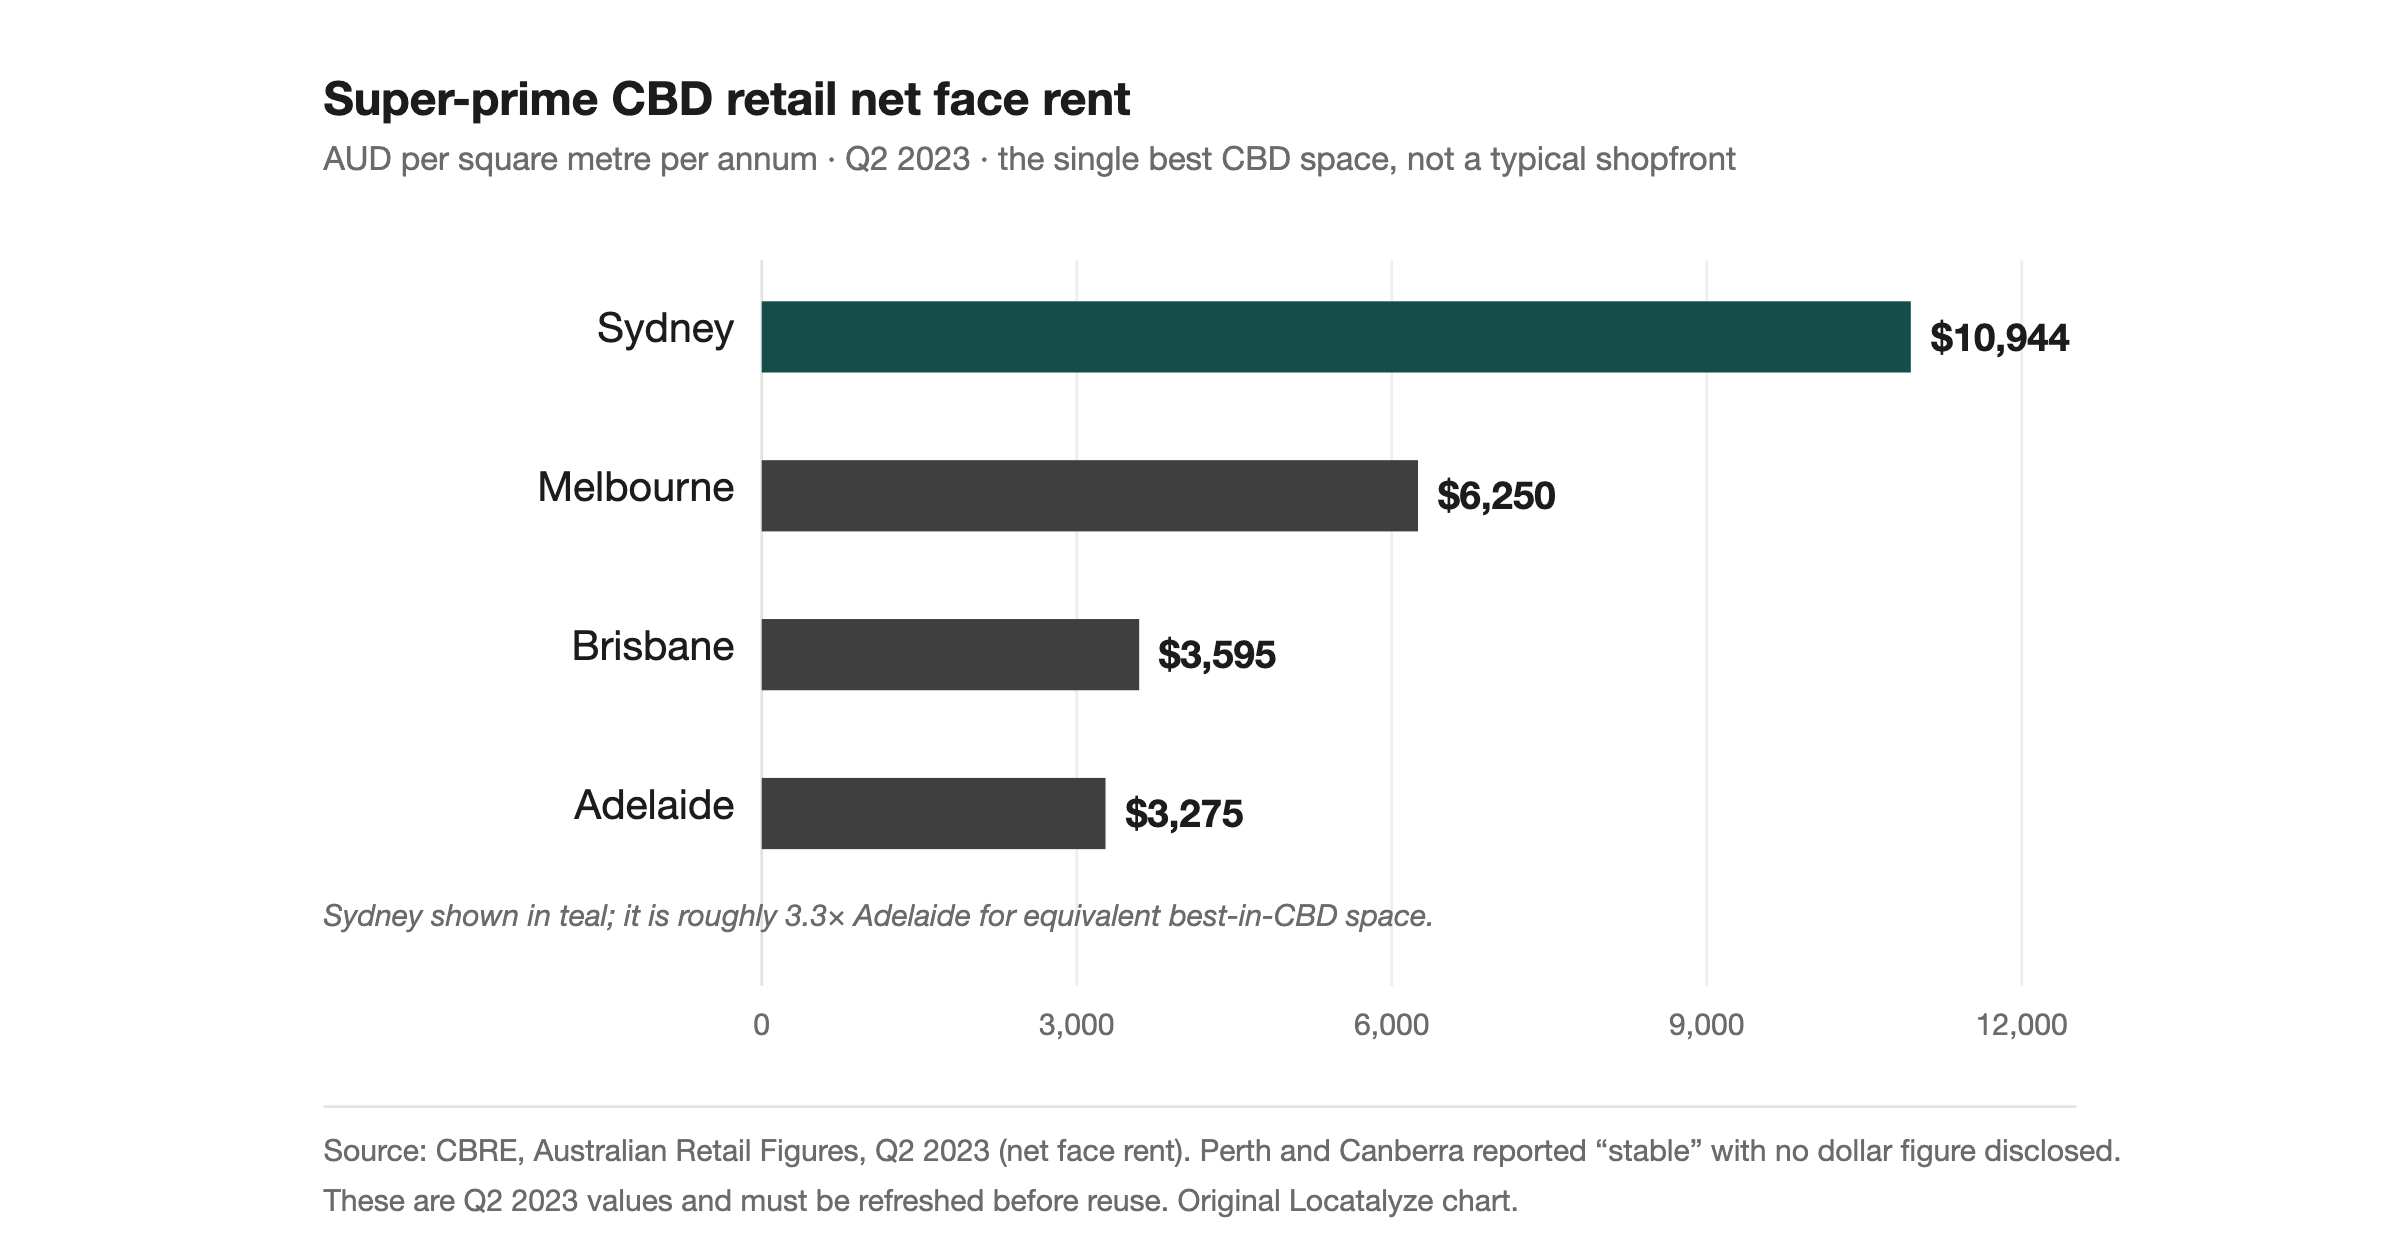
It does not offer site-specific rent benchmarks. There is no defensible single dollar-per-square-metre figure across Australian cafe formats and locations, so this piece deliberately gives none, and treats rent-to-revenue as an arithmetic framework rather than a sourced statistic. If you want to go deeper on how lease costs actually vary, we have a separate piece on how commercial rent per square metre behaves across Australian markets — but even there, the honest answer is that the number is local, not national.
It does not predict individual outcomes. The survival rate is a base rate across a cohort. It tells you the odds you are playing against; it does not tell you which side of them your specific lease will land. The whole point of analysing a site is to move yourself toward the better tail of that distribution, not to receive a guarantee.
And it does not cover macroeconomic shocks. The FY24 to FY25 surge in insolvencies coincided with elevated interest rates and cost inflation (ASIC, FY2023–24; CreditorWatch, February 2025). A different rate cycle would shift the base rate up or down for everyone. Location is the variable you control; the cycle is not.
What this means before you sign
The practical implication is uncomfortable, because it moves the decision earlier than most operators want it. By the time a cafe is open and underperforming, almost every lever that mattered has already been pulled. The rent is fixed. The footfall is whatever the footpath delivers. The competition is whoever is already trading nearby. You can sharpen the menu, retrain the floor, push the marketing — and you should — but you are now optimising inside a box whose dimensions were set the day you signed. The cafe failure rate in Australia is, in large part, a record of sites chosen before the arithmetic was checked.
So check it first. Before the lease, estimate the walk-past honestly, derive the revenue ceiling it implies, and test the gross effective rent against that ceiling rather than against the agent's optimism. Map the competition against the real depth of the catchment, not a radius drawn on a screen. Confirm the site has more than one trading daypart carrying its week. Then decide whether the rent fits under the revenue the location can actually produce — and if it does not, walk, no matter how good the corner looks at 8am on a Tuesday. The 54% who survive four years are not luckier. They mostly did this maths while they still had the option to say no. The broader location analysis platform extends the same logic across formats and cities. The site is the decision. Make it there.
If you want that maths done on a specific address before you commit, you can run a free location analysis on any Australian site and see the footfall, competition and rent-fit picture in one place.
Analyse your address →References
Australian Bureau of Statistics, *Counts of Australian Businesses, including Entries and Exits* (released 16 December 2025): 13.9% national business exit rate in 2024–25; 370,500 exits and 437,150 entries against 2,729,648 businesses trading at 30 June 2025. <a href="https://www.abs.gov.au" rel="noopener">abs.gov.au</a>
Australian Bureau of Statistics, *Retail Trade, Australia*, cited via Restaurant & Catering Australia (August 2025): cafe, restaurant and takeaway sector turnover of $66.273 billion in FY25, up 2.5% year on year. abs.gov.au
Australian Securities and Investments Commission, *Annual insolvency data, FY2023–24* (25 July 2024): Accommodation and Food Services the second-largest source of corporate insolvency, 1,667 companies and 15% of all external administrations, behind Construction at 27%; more than 11,000 companies entered external administration in FY24, up 39% year on year. <a href="https://www.asic.gov.au" rel="noopener">asic.gov.au</a>
Australian Securities and Investments Commission, insolvency data reported April 2025: Accommodation and Food Services insolvencies up 57% in the twelve months to March 2025, 1,837 against 1,168. asic.gov.au
CreditorWatch, *Business Risk Index* (20 February 2025): 9.2% of Food and Beverage Services businesses failed in the twelve months to 31 January 2025, a record high, attributed to rents, wages, insurance, interest rates and food prices. <a href="https://www.creditorwatch.com.au" rel="noopener">creditorwatch.com.au</a>
Tourism Research Australia, *Tourism Businesses in Australia: June 2019 to 2024* (built on ABS Counts of Australian Businesses, Entries and Exits, CABEE): 54% of cafes, restaurants and takeaway businesses operating in June 2020 were still operating in June 2024, among the lowest of any category, against 64% for all Australian businesses. <a href="https://www.tra.gov.au" rel="noopener">tra.gov.au</a>
About the author
Locatalyze Research Team
Location intelligence, Locatalyze
The Locatalyze research team builds the location-scoring models behind the platform and writes up what the data shows for Australian operators.
Tools first — then a full report for your address
Free rent, viability, and break-even checks. Upgrade when you are ready for competitors, map, and numbers for a specific site.
No signup required for tools