An operator I sat across from last year had approached choosing a business location the way most people do, running the sum every operator runs. He had a cafe concept, a five-year lease in front of him on a quiet inner-suburban strip, and a spreadsheet. The strip was cheaper than the busy road four hundred metres away, and his model said the rent saving covered the lower foot traffic. He had priced the downside honestly, as he saw it: if the site underperformed, he would lose maybe sixty or seventy thousand dollars of revenue against plan in the first year, and he could wear that while the trade built. What he had not priced was everything that happens when a quiet strip stays quiet and the lease has four years left to run. That is the number that ends businesses, and almost nobody puts it on the spreadsheet before signing.
This is the central problem with choosing a business location. The revenue downside is the part you can see, so it is the part you model. You picture slower weeks, a softer average spend, a longer ramp, and you ask whether the cheaper rent buys enough margin to survive that. It is a reasonable question. It is also about a third of the real question. The full cost of getting the suburb wrong runs to roughly two to four times the lost-revenue figure once you stack the things the spreadsheet leaves out: the lease-break fee or settlement to exit early, the fit-out you wrote off, the make-good bill to hand the premises back, the brand damage that follows you to the next site, the opportunity cost of the owner's two years, and the time it takes to recover and start again. None of those show up in a first-year revenue model. All of them land if the site fails.
I want to be precise about what is sourced here and what is not, because this distinction matters more than any single dollar figure. The two-to-four multiplier is operator framework arithmetic. It is a way of organising the costs, not a published statistic, and the indicative dollar values I attach to each component below are illustrative — they are built from real cost categories and real industry ranges, but the specific weightings are mine, marked as such, and your site will differ. What is sourced, and sits underneath the whole argument, is the survival and insolvency record: how often these businesses fail, which industries fail most, and what the law says you owe when you walk away from a lease. Those are the load-bearing facts. The framework just stacks them.
The number on the spreadsheet, and the six it hides
Start with how a location goes wrong, because it is rarely dramatic. A site does not usually fail because of one catastrophe. It fails because the catchment was thinner than it looked, the foot traffic converted worse than the count suggested, the anchor that drew people left, or the strip never had the daytime population to support a lunch trade. The revenue comes in fifteen or twenty per cent under plan, month after month, and the operator keeps topping up from savings and the owner's unpaid hours because the alternative — admitting the site is wrong — costs so much more than the monthly shortfall. That is the trap. The monthly bleed feels survivable, so you survive it, right up until the lease runs out or the money does.
When the decision finally comes, the bill arrives in six parts beyond the lost revenue, and here is where the framework lives.
The first is the lease-break cost. A fixed-term commercial lease does not let you simply leave. Early exit from a fixed term generally requires the landlord's agreement and a financial settlement, often described as a break-lease fee, and even where you assign the lease to a new tenant, a "no release" clause can leave you, the outgoing tenant, liable if that new tenant later defaults (NSW Small Business Commissioner). I have deliberately not attached a dollar figure to this, because there is no standard one — it depends on the rent, the remaining term, how quickly the landlord re-lets, and what you negotiate. But it is a real, non-trivial liability, and operators routinely discover it only when they try to leave.
The second is the fit-out write-off. This is usually the largest single line, and it is the most quietly brutal, because the money is already spent and gone. Australian fit-out costs for hospitality sit in a wide, self-reported range: a cafe fit-out in Sydney runs roughly $1,500 to $2,500 or more per square metre, with project totals from around $80,000 for a basic espresso bar up to $350,000–$700,000 or more for a full-service cafe or restaurant of 80–150 square metres (Australian fit-out industry estimates, 2024–2026). When a site fails, that entire sum is written off. It does not move to the next premises. The joinery was built for that room, the kitchen was specified for that gas and that grease trap, and the brand was fitted to that frontage. You start the next fit-out from a blank invoice.
The third is make-good. Most commercial leases require the tenant to return the premises to near their original condition at the end of the term — strip out the fit-out, repair, repaint, reinstate services. The NSW Small Business Commissioner is clear that the Act sets no dollar standard for this; the obligation is whatever the lease specifies, and it can be substantial. So the same fit-out you have already written off generates a second, separate bill to remove. You pay to build it, you pay to rip it out, and you owe that make-good even on a site that never made money.
The fourth is brand damage, and this one resists numbers entirely, which is exactly why operators discount it to zero. A cafe that opened to fanfare and closed within two years carries that into its next venture — with suppliers, with a landlord checking references on the next lease, with staff deciding whether to follow, and with a local market that remembers the shutters going up. It is real, it is costly, and it is unmeasurable, so it gets left out. Leaving it out does not make it cheaper.
The fifth is owner opportunity cost. The eighteen or twenty-four months the owner poured into a failing site were eighteen or twenty-four months not spent on a viable one, not earning a wage elsewhere, not building something that compounds. Economists call this the opportunity cost; operators feel it as the most expensive line of all and almost never enter it, because there is no invoice for the road not taken.
The sixth is recovery time. After a failure, the operator does not begin the next venture the following Monday. There is the wind-down, the settlement, the savings to rebuild, the confidence to repair, and often debt to clear first. The gap between sites is months at best and frequently years, and that gap is itself a cost, because the clock that was supposed to be building equity is instead running backwards.
Stack those six on top of the lost revenue and you can see why the headline number on the spreadsheet — the revenue gap — is the smallest part of the real figure. The chart at the top of this page lays the stack out as an index, with lost revenue set to 100 and each other component sized as an indicative weighting. Read it as a framework, not a forecast. Only the base is fixed; everything above it is illustrative and will shift with your lease, your fit-out and your city.
Why choosing a business location is a maths problem, not a hospitality one
It would be easy to read all of this as a story about cafes being risky, and there is a version of that story in the data. But the failure record is better understood as a verdict on location decisions than on the food trade itself, and the numbers support reading it that way.
The aggregate first. More than 11,000 companies entered external administration in FY2023-24, a rise of 39 per cent on the prior year (ASIC, Annual insolvency data, FY2023-24). Within that, Accommodation and Food Services was the second-largest source of corporate insolvency, accounting for 15 per cent of all external administrations, behind only Construction at 27 per cent (ASIC, FY2023-24). The pressure has not eased since. Accommodation and Food Services insolvencies rose 57 per cent in the twelve months to March 2025, climbing to 1,837 from 1,168 a year earlier (ASIC monthly insolvency data, reported March 2025). And at the whole-economy level, the national business exit rate for 2024-25 was 13.9 per cent, with 370,500 businesses leaving the population (ABS, Counts of Australian Businesses, released 16 Dec 2025).
Now the survival gap, which is the single most useful figure for anyone weighing a site. Of the cafes, restaurants and takeaway businesses trading in June 2020, 54 per cent were still trading in June 2024, against 64 per cent for all businesses — placing food services among the lowest-surviving industries in the country (Tourism Research Australia, Tourism Businesses in Australia June 2024, on ABS CABEE data). Ten percentage points separate the food trade from the all-business baseline over four years. That gap is the cost of a sector where the location decision is unusually unforgiving: hospitality lives or dies on catchment, foot traffic, daypart mix and proximity in a way that a business able to serve customers remotely simply does not.
Here is the move that matters. A ten-point survival gap is not destiny spread evenly across every cafe. It is an average across thousands of sites, and the variance inside it is enormous. Some of those failures were undercapitalised or poorly run, and no location would have saved them. But a meaningful share were viable concepts placed on the wrong strip — the right cafe two hundred metres from where it would have worked, or one suburb across from a catchment that could have carried it. For that share, the location decision was the failure, and the sector survival number is the price of getting it wrong, paid at scale. The aggregate is sourced and solid. The reading — that location choice drives a large part of the gap — is the analyst's judgement, and I will defend it: the businesses that fail most are precisely the ones whose economics are most tied to their exact patch of ground.
The same cafe, two suburbs: a framework, laid bare
To make the stack concrete, take one business type and run it twice. The same cafe — same operator, same concept, same fit-out budget — on two different strips. One viable, one not. I am going to lay the financial trail bare, but I want to be explicit before I do: this is a labelled framework, not a case study of a named business. I could not verify a single real, named cafe failure with an itemised lease-break, fit-out and make-good ledger that could be printed honestly, so I have not invented one. The survival, insolvency, fit-out and vacancy anchors are sourced. The per-site dollar cells are illustrative, built from those sourced ranges, and every illustrative cell is marked.
Set the shared inputs. The fit-out is a mid-range full-service cafe build at $220,000 — squarely inside the sourced $80,000-to-$700,000-plus band, toward the lower-middle for an 80–150 square metre full-service room (Australian fit-out industry estimates, 2024–2026). The lease is five years. The concept is identical. The only variable is the suburb.
Read the table as a structure, not a quote. The viable strip is the boring outcome: the fit-out stays in the ground earning its keep, no exit is triggered, the make-good obligation sits quietly at the far end of the term, and the owner's time compounds into equity. The sub-viable strip is where the stack fires. The $220,000 fit-out — a real figure inside the sourced range — is written off in full. The lease-break and make-good obligations, both real cost categories with no statutory dollar standard, both land. The owner loses twenty months they will not get back. And the lost revenue that the original spreadsheet modelled, indexed here to 100, turns out to be the smallest line in the column.
That is the whole argument in one table. The operator priced the line indexed at 100 and stopped. The actual cost of the wrong suburb was the rest of the column, two to four times larger, and it was knowable in advance because the suburb was knowable in advance.
Where the trap is sharpest: the secondary strip
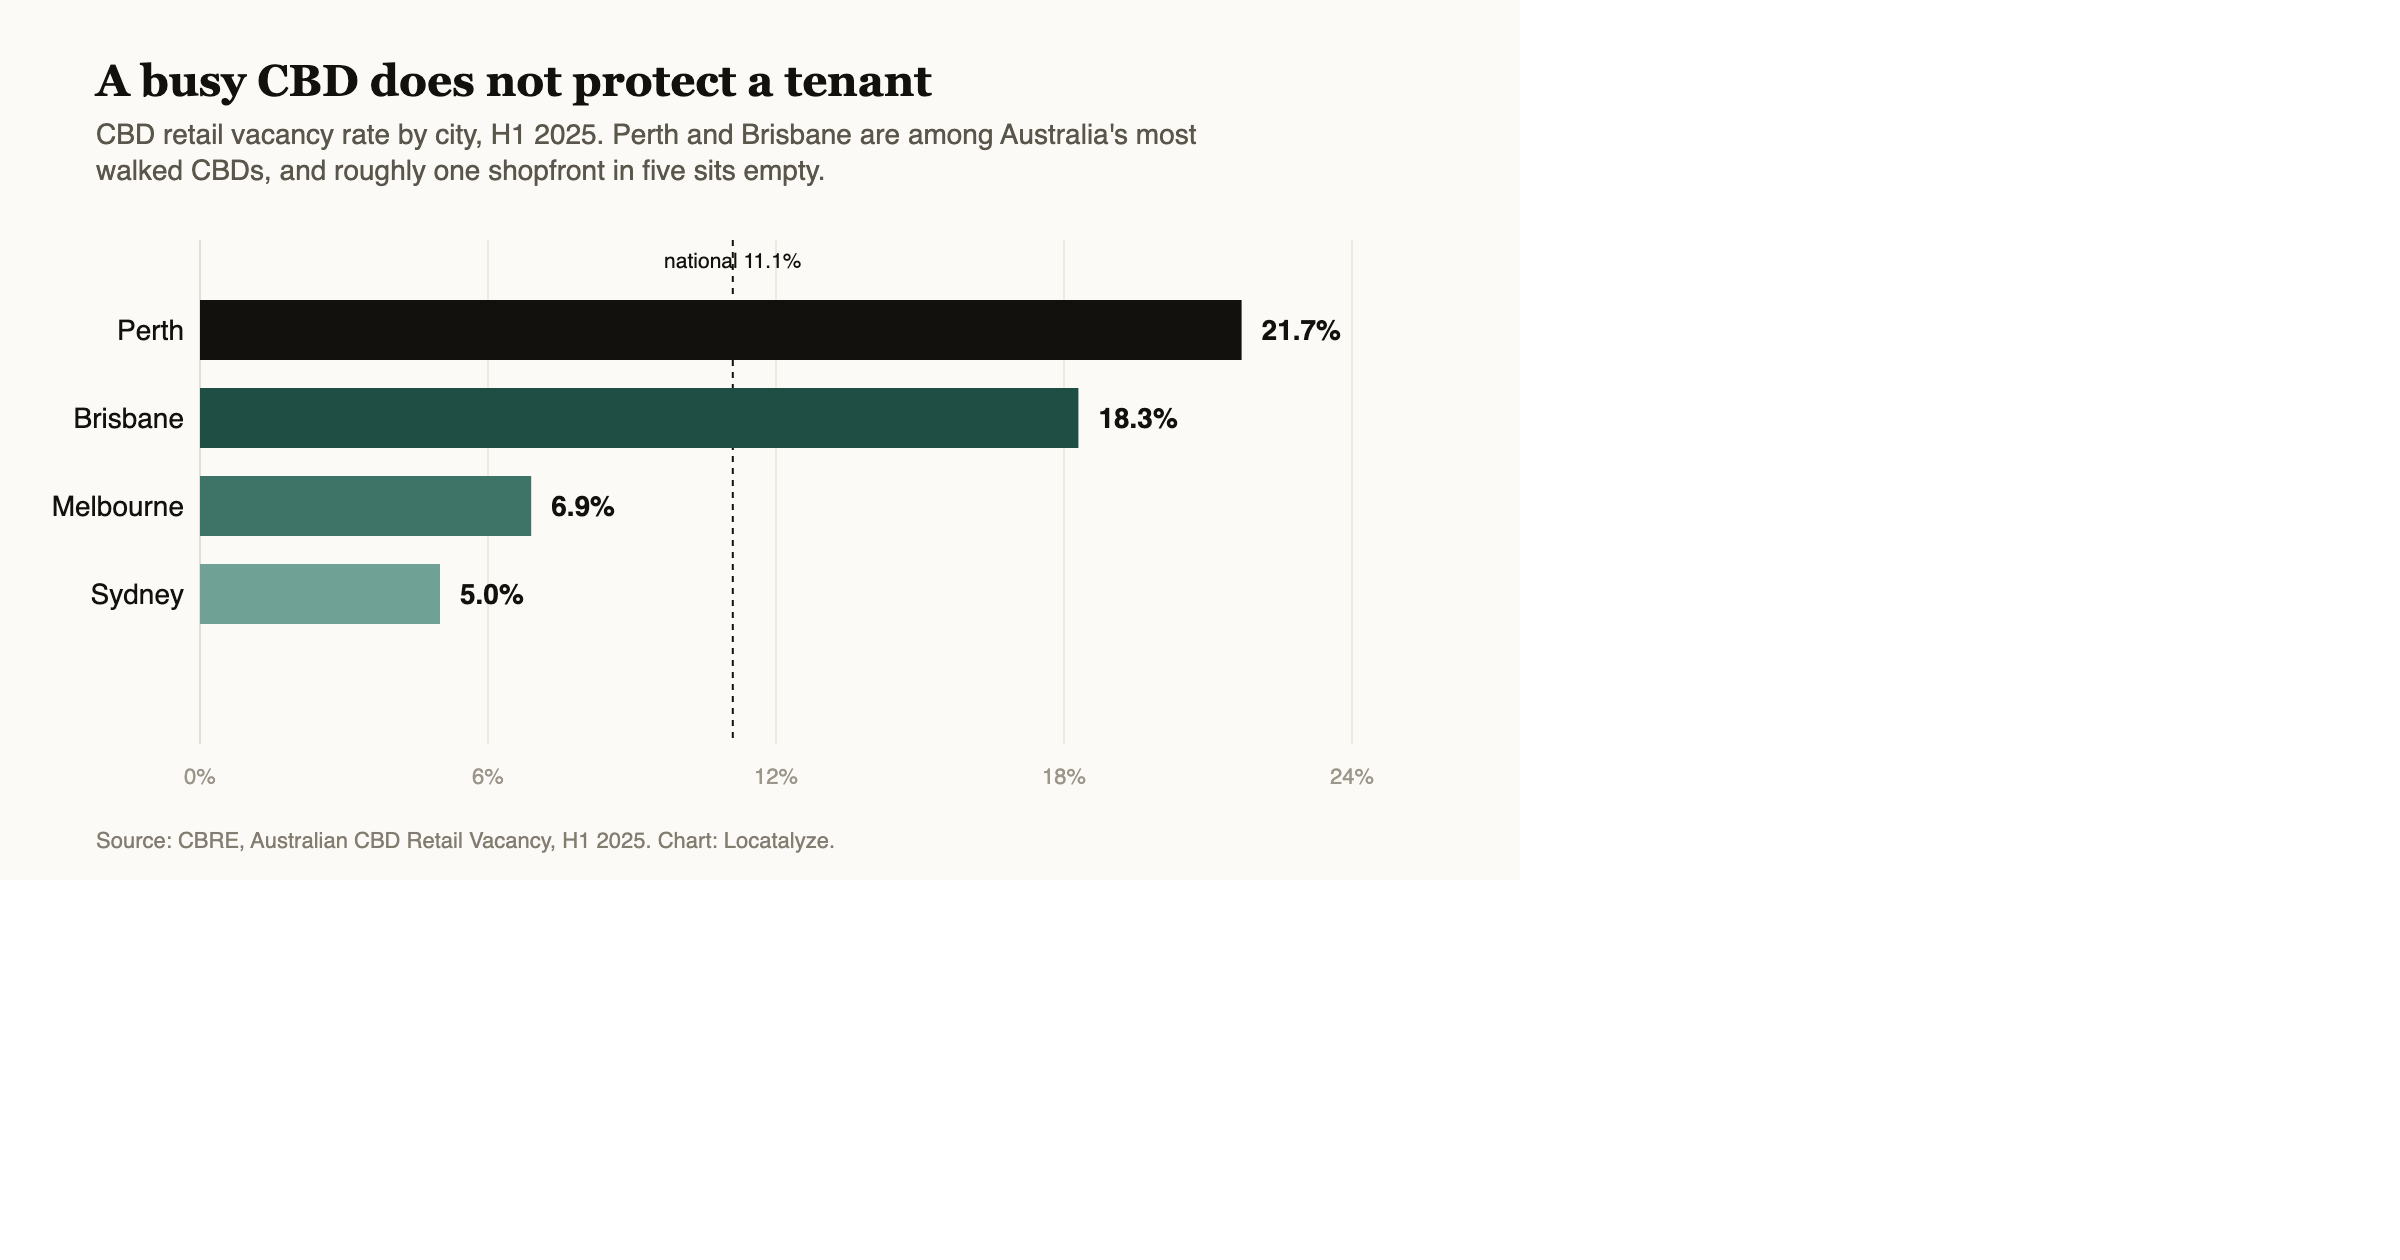
There is an important nuance here that separates a careful analysis from a scare story, and it runs through vacancy. The "stuck with a lease you cannot exit and cannot fill" risk is not uniform across Australia. National CBD retail vacancy was 11.1 per cent in the first half of 2025, but the two largest markets were far tighter — Sydney CBD at 5.0 per cent and Melbourne CBD at 6.9 per cent (CBRE, CBD Retail Vacancy, H1 2025). Prime CBD retail is tightening, not loosening. In those cores, a landlord facing a departing tenant has a realistic prospect of re-letting, which gives you negotiating room on an exit and limits how long the lease hangs around your neck.
The trap is sharpest somewhere else: the secondary and suburban strips, where vacancy is higher, demand is patchier, and a landlord staring at a long re-letting void has every reason to hold a departing tenant to the full remaining term. That is exactly where a "no release" assignment clause bites hardest, and exactly where the lease-break settlement is least negotiable, because the landlord's alternative to settling with you is an empty shop for months. So the cost stack is not evenly distributed. It is heaviest precisely on the cheaper, quieter strips that attract budget-conscious operators in the first place — the strips chosen, as my cafe operator chose his, because the rent saving looked like it covered the foot-traffic gap. The cheaper rent and the harder exit are the same coin.
This is why the suburb-level read has to come before the lease is signed, not after. Once you have signed, your options collapse to the ones the lease and the local vacancy rate allow you. Before you sign, the whole question is still open, and the difference between a viable strip and a sub-viable one a few hundred metres away is the difference between the left and right columns of that table. Working through the catchment, the foot traffic and the competitive density of a specific address — the kind of structured read in our retail site-selection metrics breakdown — is cheap relative to the stack it is trying to prevent.
Run a free read on the exact address before you commit — the entire reason the tool exists is to make the suburb decision before it becomes a lease decision.
Analyse your address →What this analysis does not cover
I would rather state the limits plainly than imply a precision this does not have.
First, the named-case gap. I could not verify a single specific, named Australian business failure with a publicly documented, itemised ledger of lease-break, fit-out write-off and make-good costs. Such failures happen constantly, but the figures sit inside private settlements, administrators' reports and confidential leases, not in the open record. Rather than invent a business, an owner, a quote or a precise profit-and-loss to make the piece feel more concrete, I have used clearly-labelled anonymised scenarios built on the aggregate data, and anchored the spine to figures that are genuinely public: the sector survival rate, the insolvency shares, the fit-out ranges and the city vacancy numbers. If you see a blog elsewhere with a tidy named-business ledger and round, confident totals, treat it with suspicion unless it cites a court filing or an administrator's report.
Second, the multiplier is a framework, not a measured constant. The two-to-four range is a way of reasoning about a cost structure that is genuinely larger than the revenue line — it is not a statistic anyone has derived from a dataset of failed leases, because that dataset is not public. For some failures the multiple is smaller; for a heavily fitted-out site on a long lease in a high-vacancy strip, it can be larger. Use it to widen your thinking, not to forecast a precise bill.
Third, the dollar values inside the framework are illustrative. The $220,000 fit-out sits inside a real sourced range, but it is a representative figure, not a quote for your build. The lease-break and make-good obligations are real cost categories with no statutory dollar standard (NSW Small Business Commissioner), which is precisely why I have refused to print invented amounts for them. Your numbers will come from your lease, your fit-out and your city, and they are knowable for your site even though they are not knowable in general.
What to actually do with this
The practical implication is narrower than it sounds, and it is not a checklist. It is a reordering of when you spend your attention.
Most operators spend their hardest analytical effort after signing — on the menu, the roster, the supplier terms, the marketing — and almost none of it on the suburb, which they decide on rent, gut feel and a couple of weekend visits. That ordering is backwards relative to where the cost sits. Every line in the stack above is set in motion by the location choice and locked in by the signature on the lease. The menu can be changed on a Tuesday. The suburb cannot be changed at all without paying the full stack to leave. So the single most decisive hour you will spend on the whole venture is the one before you sign, spent honestly answering whether this specific address has the catchment, the foot traffic and the daypart population to carry the concept — and whether, if it does not, the local vacancy rate will let you exit without the full stack landing on you.
That honest answer is buildable. The survival data tells you the base rate, ASIC's insolvency record tells you the trajectory, the NSW Small Business Commissioner's lease guidance tells you what you will owe on the way out, and CBRE's vacancy data tells you how hard the exit will be in your market. A structured location read pulls those together against one address. Whether you are weighing a strip in Sydney, a suburb in Melbourne, or a corner in Brisbane, the question is the same and the cost of answering it badly is the same. If you want the full structured read rather than the back-of-envelope version, that is what Locatalyze's location analysis is built to produce. The cafe operator I started with did the cheap sum and skipped the expensive one. The expensive one was the only one that mattered, and it was sitting there to be done before he signed.
If there is one thing to carry out of this, it is that the lost-revenue number you can see is not the cost of choosing the wrong suburb. It is the deposit on it. The rest of the bill is sitting in the lease, the fit-out and the calendar, waiting, and the only moment you control it is before the pen touches the page. For the sector-level version of this argument, with the survival and insolvency record laid out in full, see our piece on the Australian cafe failure rate; for what the lease itself will cost you per square metre across the capitals, see the commercial rent per sqm reference.
References
ASIC, Annual insolvency statistics, FY2023-24 — more than 11,000 companies entered external administration, up 39% year-on-year; Accommodation and Food Services was the second-largest source of corporate insolvency at 15% of all external administrations, behind Construction at 27%. <a href="https://www.asic.gov.au" rel="noopener" target="_blank">asic.gov.au</a>
ASIC, monthly insolvency data, reported March 2025 — Accommodation and Food Services insolvencies rose 57% in the twelve months to March 2025, to 1,837 from 1,168. <a href="https://www.asic.gov.au" rel="noopener" target="_blank">asic.gov.au</a>
ABS, Counts of Australian Businesses, including Entries and Exits, released 16 December 2025 — national business exit rate for 2024-25 of 13.9%, equal to 370,500 exits. <a href="https://www.abs.gov.au" rel="noopener" target="_blank">abs.gov.au</a>
Tourism Research Australia, Tourism Businesses in Australia June 2024 (on ABS CABEE) — 54% of cafes, restaurants and takeaway businesses trading in June 2020 were still trading in June 2024, against 64% for all businesses; among the lowest-surviving industries. <a href="https://www.tra.gov.au" rel="noopener" target="_blank">tra.gov.au</a>
NSW Small Business Commissioner — make-good provisions require returning premises to near original condition (remove fit-out, repaint, reinstate services), with no dollar standard set by the Act; early exit from a fixed term generally requires landlord agreement for a financial settlement or break-lease fee, and lease assignment can leave the outgoing tenant liable under "no release" clauses. <a href="https://www.smallbusiness.nsw.gov.au" rel="noopener" target="_blank">smallbusiness.nsw.gov.au</a>
CBRE, CBD Retail Vacancy, H1 2025 — national CBD retail vacancy 11.1%, Sydney CBD 5.0%, Melbourne CBD 6.9%; prime CBD retail tightening, with the "stuck with the lease" risk strongest in secondary and suburban strips rather than prime CBD. <a href="https://www.cbre.com.au" rel="noopener" target="_blank">cbre.com.au</a>
Australian fit-out industry estimates, 2024–2026 — self-reported cafe fit-out costs of roughly $1,500–$2,500+/sqm in Sydney, with project totals from around $80,000 (basic espresso bar) to $350,000–$700,000+ (full-service cafe or restaurant, 80–150 sqm); wide ranges, written off when a site fails.
About the author
Locatalyze Research Team
Location intelligence, Locatalyze
The Locatalyze research team builds the location-scoring models behind the platform and writes up what the data shows for Australian operators.
Tools first — then a full report for your address
Free rent, viability, and break-even checks. Upgrade when you are ready for competitors, map, and numbers for a specific site.
No signup required for tools