Two operators sign leases in the same month, three suburbs apart, both opening a cafe in a tenancy of roughly the same size at roughly the same rent. One checks three things before signing: the rent, the look of the foot traffic on the day she visits, and whether there is already a cafe on the block. The other checks seven. Eighteen months later the first operator is renegotiating with a landlord who has no obligation to move, watching her occupancy cost drift past the line where the numbers stop working. The second is trading through her first slow winter without panic, because she priced the slow winter in before she signed. The suburbs were not the difference. The number of things each one checked was the difference, and that gap is what retail site selection comes down to.
That is the uncomfortable finding behind most retail site selection work. Operators who succeed are not unusually gifted at picking the right postcode. The postcode is rarely the decision that sinks a venue. What separates the durable operators is coverage: they run a wider checklist, and they check the hard items as carefully as the easy ones. The easy items — visible rent, visible foot traffic, visible competition — are exactly the ones every other applicant for that tenancy has already looked at. The items that actually predict whether a site carries a business through five years are the ones that take effort to measure, and most applicants skip them.
This piece sets out the seven metrics that matter, in the order a careful operator works through them, with the Australian numbers that anchor each one where those numbers genuinely exist. Two of the seven rest on industry rules-of-thumb and academic frameworks rather than hard published statistics, and those are flagged plainly so you can weight them accordingly. The other five lean on sourced material: census geography from the Australian Bureau of Statistics, business counts and survival data at small-area level, building approvals as a supply pipeline, and the leasing law that governs what a landlord can and cannot put in front of you. The aim is not a longer to-do list for its own sake. It is to show what each metric looks like when it is checked superficially versus when it is checked properly, because the gap between those two is where leases go wrong.
A note before the seven. None of this replaces a site visit, a lawyer reading the lease, and an accountant stress-testing the model. It sits in front of those steps. It tells you which sites are worth paying a lawyer to look at, and which ones to walk away from before you spend a dollar. If you want the same analysis run against a specific address rather than read as a framework, that is what our location analysis tool is built to do.
1. Rent-to-revenue ratio (occupancy cost)
The first metric is the one most operators think they have already checked when they have only half-checked it. Rent in isolation tells you nothing. A $9,000-a-month tenancy is cheap for a venue turning over $150,000 a month and ruinous for one turning over $60,000. The number that means something is occupancy cost: total property cost — base rent, outgoings, any promotional levy or marketing fund, GST treatment aside — expressed as a percentage of revenue.
How to measure it honestly: build the revenue estimate first, conservatively, and divide gross rent plus outgoings by it. Do not use the landlord's revenue assumption. Do not use the previous tenant's good year. Use a number you would still hit in a quiet quarter.
The familiar bands — roughly 8 to 12 per cent of revenue for hospitality, 6 to 10 per cent for retail — are an industry rule-of-thumb, not a sourced statistic, and they should be labelled as such whenever they are quoted. They are useful as a sanity check and dangerous as a target. What can be cited: specialty stores under 450 square metres in Australian shopping centres commonly run occupancy costs in the 10 to 20 per cent range (LeaseInfo, 2024), which is higher than the strip-retail rule-of-thumb because centre tenancies carry marketing levies and higher outgoings on top of base rent. And Australian hospitality practitioners flag rent above roughly 10 per cent of net revenue as the danger line where a cafe's margin structure starts to fail (Cafe Bookkeepers, AU). Treat both as practitioner and commercial sources rather than government data.
The failure mode if ignored is slow and quiet. A venue that opens at 14 per cent occupancy cost is not in crisis on day one. It is in crisis the first time revenue dips 15 per cent and the rent does not move, because rent under most Australian retail leases reviews upward, never down — a point that returns in metric seven. Occupancy cost is the metric that converts a soft trading patch into a closure. For the full cost of getting this one wrong, the companion piece on the cost of choosing the wrong business location works the numbers through to the end.
2. Demographic match, not population
The second metric is where superficial site selection fails most often, because the superficial version looks quantitative. An applicant pulls the suburb population, notes that it is large or growing, and treats that as demand. Population is not demand. A suburb of 30,000 people who are wrong for your offer is worse than a pocket of 4,000 who are right, because the 30,000 generate footfall that walks past your door without converting, and footfall you cannot convert still costs you rent.
What demographic match means is the fit between the people inside your actual catchment and the customer your business needs: age structure, household composition, income, the language and cultural mix that determines whether your menu or range lands, and the daytime-versus-residential split that decides whether a lunch trade exists. The unit of measurement is what separates careful work from lazy work. The Australian census resolves to the SA1 — the Statistical Area Level 1, holding 200 to 800 residents with an average near 400 (ABS, ASGS Edition 3, 2021 Census). That is roughly a few streets. A suburb-level or SA2-level read — the SA2 holds 3,000 to 25,000 people (ABS, ASGS Edition 3) — averages over exactly the variation that decides your trade. A single SA2 can contain a wealthy enclave and a struggling pocket inside one number.
How to measure it honestly: pull the census DataPacks for the SA1s that fall inside your real catchment, not the suburb your address sits in, and weight them by how reachable each one is from your door. A high-income SA1 on the far side of a six-lane road is not your customer. Build the demographic picture from the SA1s a customer would actually walk or drive from.
The failure mode is the venue that is correct in the abstract and wrong in fact: a specialty offer placed in a suburb whose headline median income suggested affluence, when the SA1s within walking distance skew to renters and students who were never going to be the customer. The number was right at suburb scale and wrong at the only scale that matters.
3. Catchment density and gradient
Demographic match tells you who is nearby. Catchment density and gradient tell you how many of them, and how sharply their likelihood of visiting falls with distance. The practical catchment unit is the SA2, which maps tolerably well to how people describe the area they shop and eat in (ABS, ASGS Edition 3). Inside that, what you are estimating is a gradient: a customer 200 metres away is far more likely to walk in than one two kilometres away, and the rate at which that probability decays is not linear.
The framework here is the Huff (1964) gravity model, and it should be labelled as theory, not measurement. The Huff model expresses the probability that a customer travels to a given site as a function of the site's attractiveness divided by distance raised to a decay exponent, summed across competing destinations. You do not need to run the equation to use the idea. The idea is that catchment is a surface, not a circle, and that the surface decays — distance decay — faster for convenience offers (a coffee, a quick lunch) than for destination offers (a specialist retailer someone will drive to). A cafe lives or dies on the first 400 metres. A destination homewares store draws from a wider, flatter gradient.
How to measure it honestly: count the residents and the daytime workers inside realistic travel-time bands, not straight-line radii, and weight the near bands far more heavily than the far ones. A creek, a rail line, an arterial road or a hill collapses a catchment on one side while leaving the map looking symmetrical. The connective piece on how travel distance shapes a customer catchment sets out how to build those bands.
The failure mode is the radius trap: an operator draws a one-kilometre circle, counts everyone inside it, and signs against a population that mostly cannot or will not cross the barrier between them and the door. The catchment looked deep on paper and was shallow in practice.
4. Competition density and substitution
The superficial competition check is a headcount: how many cafes, how many of whatever you are. The careful check asks two further questions the headcount cannot answer. First, is the market saturated relative to the people in it, or is the cluster a sign of healthy demand that supports more entrants? Second, how substitutable are you against the incumbents — does a new arrival split a fixed pie, or expand it?
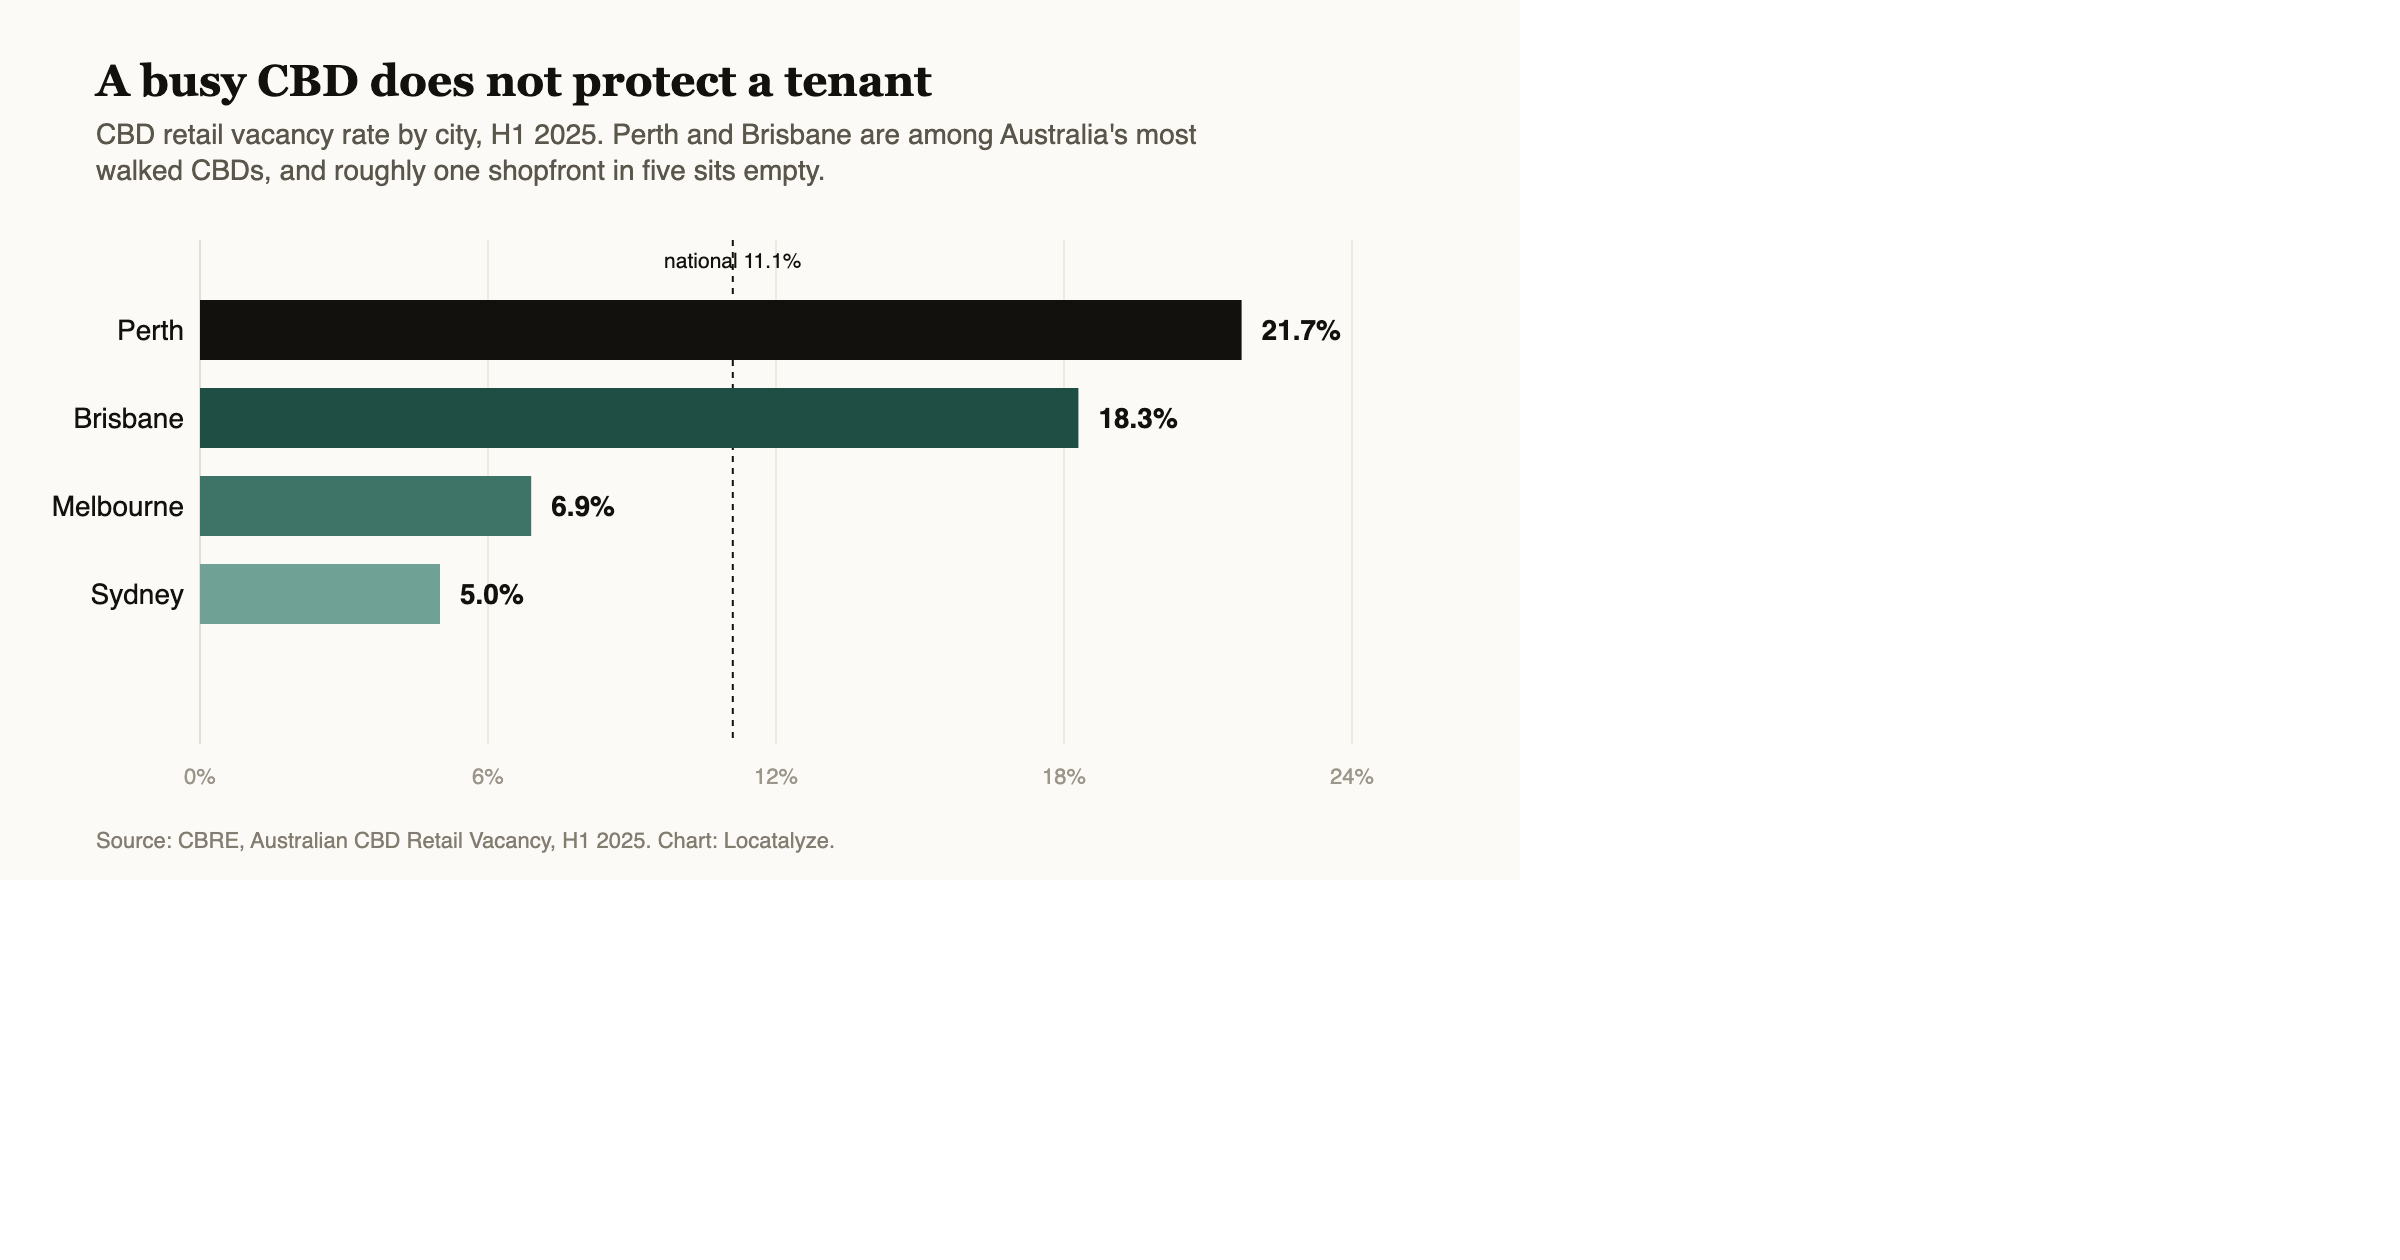
Australia has unusually good open data for the first question. The ABS reports about 2,729,648 actively trading businesses at 30 June 2025, with entries, exits and survival rates published down to SA2 level across 2,463 SA2 regions (ABS, Counts of Australian Businesses, 2021 to 2025). That means you can look up, for your actual catchment, how many businesses operate and, more tellingly, how many opened and closed and what share survived. A high closure rate in your category in your SA2 is a warning the headcount on the street will never give you, because the street only shows the survivors.
How to measure it honestly: pair the live count of direct competitors with the SA2 entry and exit data for the category, and separate genuine substitutes from adjacents. Three cafes on a strip is not three competitors if one is a destination roaster, one is a $4 takeaway window and one is a brunch sit-down venue — they occupy different demand. Counting them as identical overstates saturation; counting a true like-for-like as harmless understates it. The deeper treatment of where a trade area ends and a competitor's begins is in the note on catchment versus trade-area analysis.
The failure mode is symmetrical and both directions hurt. Read a healthy cluster as saturation and you walk away from a good site. Read a true head-to-head substitute as background noise and you open into a fight you will lose on the existing operator's home ground.
5. Accessibility
Accessibility is the metric an operator feels on the site visit and then fails to quantify. The visit answers, "can I get here?" The metric answers, "can my customer get here, repeatedly, easily, at the times my business trades?" Those are different questions, and the second one rests partly on rule-of-thumb because there is no single published accessibility statistic for a given shopfront — it is assembled from transit, parking, pedestrian flow and the friction of the immediate approach.
What it covers: the walk-up catchment and the quality of the footpath approach; public transport — distance to the nearest stop or station and the frequency of service at your trading hours; car access, including whether parking is plausible at peak and whether the kerb in front allows a stop; and the small frictions that quietly suppress trade, such as a median strip that stops a customer turning in, a corner with no safe crossing, or a tenancy set back behind a car park that pedestrians read as closed. This is framework-led measurement, so flag it as such: there is no ABS table for "ease of getting to this door."
How to measure it honestly: visit at the times you will trade, not at a convenient mid-morning. A lunch venue should be assessed at noon on a weekday, a brunch venue on a Saturday at ten. Walk the approach from each direction a customer would come. Time the trip from the nearest transit stop. Note whether cars actually stop or merely pass.
The failure mode is the site that scores well on every other metric and still underperforms because the last fifty metres defeat people. Right demographics, right catchment, manageable competition, fair rent — and a tenancy customers cannot easily reach, or reach but cannot stop at. Accessibility is the metric that turns a good catchment into a phantom one.
6. Growth trajectory (leading indicators)
The first five metrics describe the area as it is. The sixth asks where it is heading, because a five-year lease is a bet on the future of a place, not its present. The mistake is to read growth from lagging signals — last year's population, last year's median price — which tell you what already happened. What you want are leading indicators: signals of supply and activity that show up before the population and the spending do.
The standard leading indicator in the Australian context is building approvals, which the ABS publishes monthly down to SA2 and local government area level (ABS, Building Approvals, Australia). Approvals are a genuine pipeline signal: a dwelling approved is residents arriving in roughly one to three years, ahead of the census catching them. As a recent example of the series, total dwellings approved nationally fell 10.5 per cent to 17,300 in March 2026 on a seasonally adjusted basis, released 11 May 2026 (ABS, Building Approvals, Australia) — a reminder that the indicator moves in both directions and that "growth area" is a claim to verify, not assume.
How to measure it honestly: read approvals for your specific SA2 and its neighbours, not the national or capital-city headline, and pair them with what you can see on the ground — cranes, hoarding, civil works, new transport. One approved apartment block two streets away changes a catchment more than a percentage point on a state figure. Building approvals are a leading indicator of supply; they are not a promise of demand, and a wave of new dwellings can lift rents before it lifts your trade.
The failure mode is twofold. Miss the upside and you pay tomorrow's rent for yesterday's catchment in a gentrifying pocket — though the upside can also arrive as a rent rise that reaches you before the customers do. Miss the downside and you sign a five-year lease in an area whose pipeline has stalled, betting on growth the approvals data already said was not coming.
7. Lease terms versus market
The seventh metric is the one operators check last and should weight first, because it is the only one written into a binding contract. A site can pass the first six and still be a poor decision if the lease terms sit worse than the market allows. Two clauses decide most of it: how the rent moves, and what you owe when you leave.
On how the rent moves, the law is more protective than many operators realise, and knowing it changes what you accept. In New South Wales, the Retail Leases Act 1994 (NSW), section 18, provides that base rent cannot change within the first 12 months, and that ratchet clauses — provisions preventing rent from decreasing at a review — are void (Retail Leases Act 1994 (NSW) s 18). In Victoria, the Retail Leases Act 2003 (Vic), section 35, makes a provision void to the extent it precludes a rent reduction at review (Retail Leases Act 2003 (Vic) s 35). The Victorian Supreme Court confirmed the boundary in Aldi Foods v Northcote Plaza [2024] VSC 799: a cap on a rent review is permitted, but a ratchet or collar that stops the rent falling is not. So a market-rate review can legally go down, and a clause drafted to stop that is unenforceable — which means accepting one is leaving protection on the table.
On what you owe when you leave, make-good is the cost operators most often forget to price. The Victorian Small Business Commission sets out that a tenant may need to remove the fit-out, repair damage beyond fair wear and tear, and return the premises to its start-of-lease condition (VSBC, make-good guidance). Any agreement that you will not have to make good must be in writing; a verbal assurance is worth nothing at the end of a term.
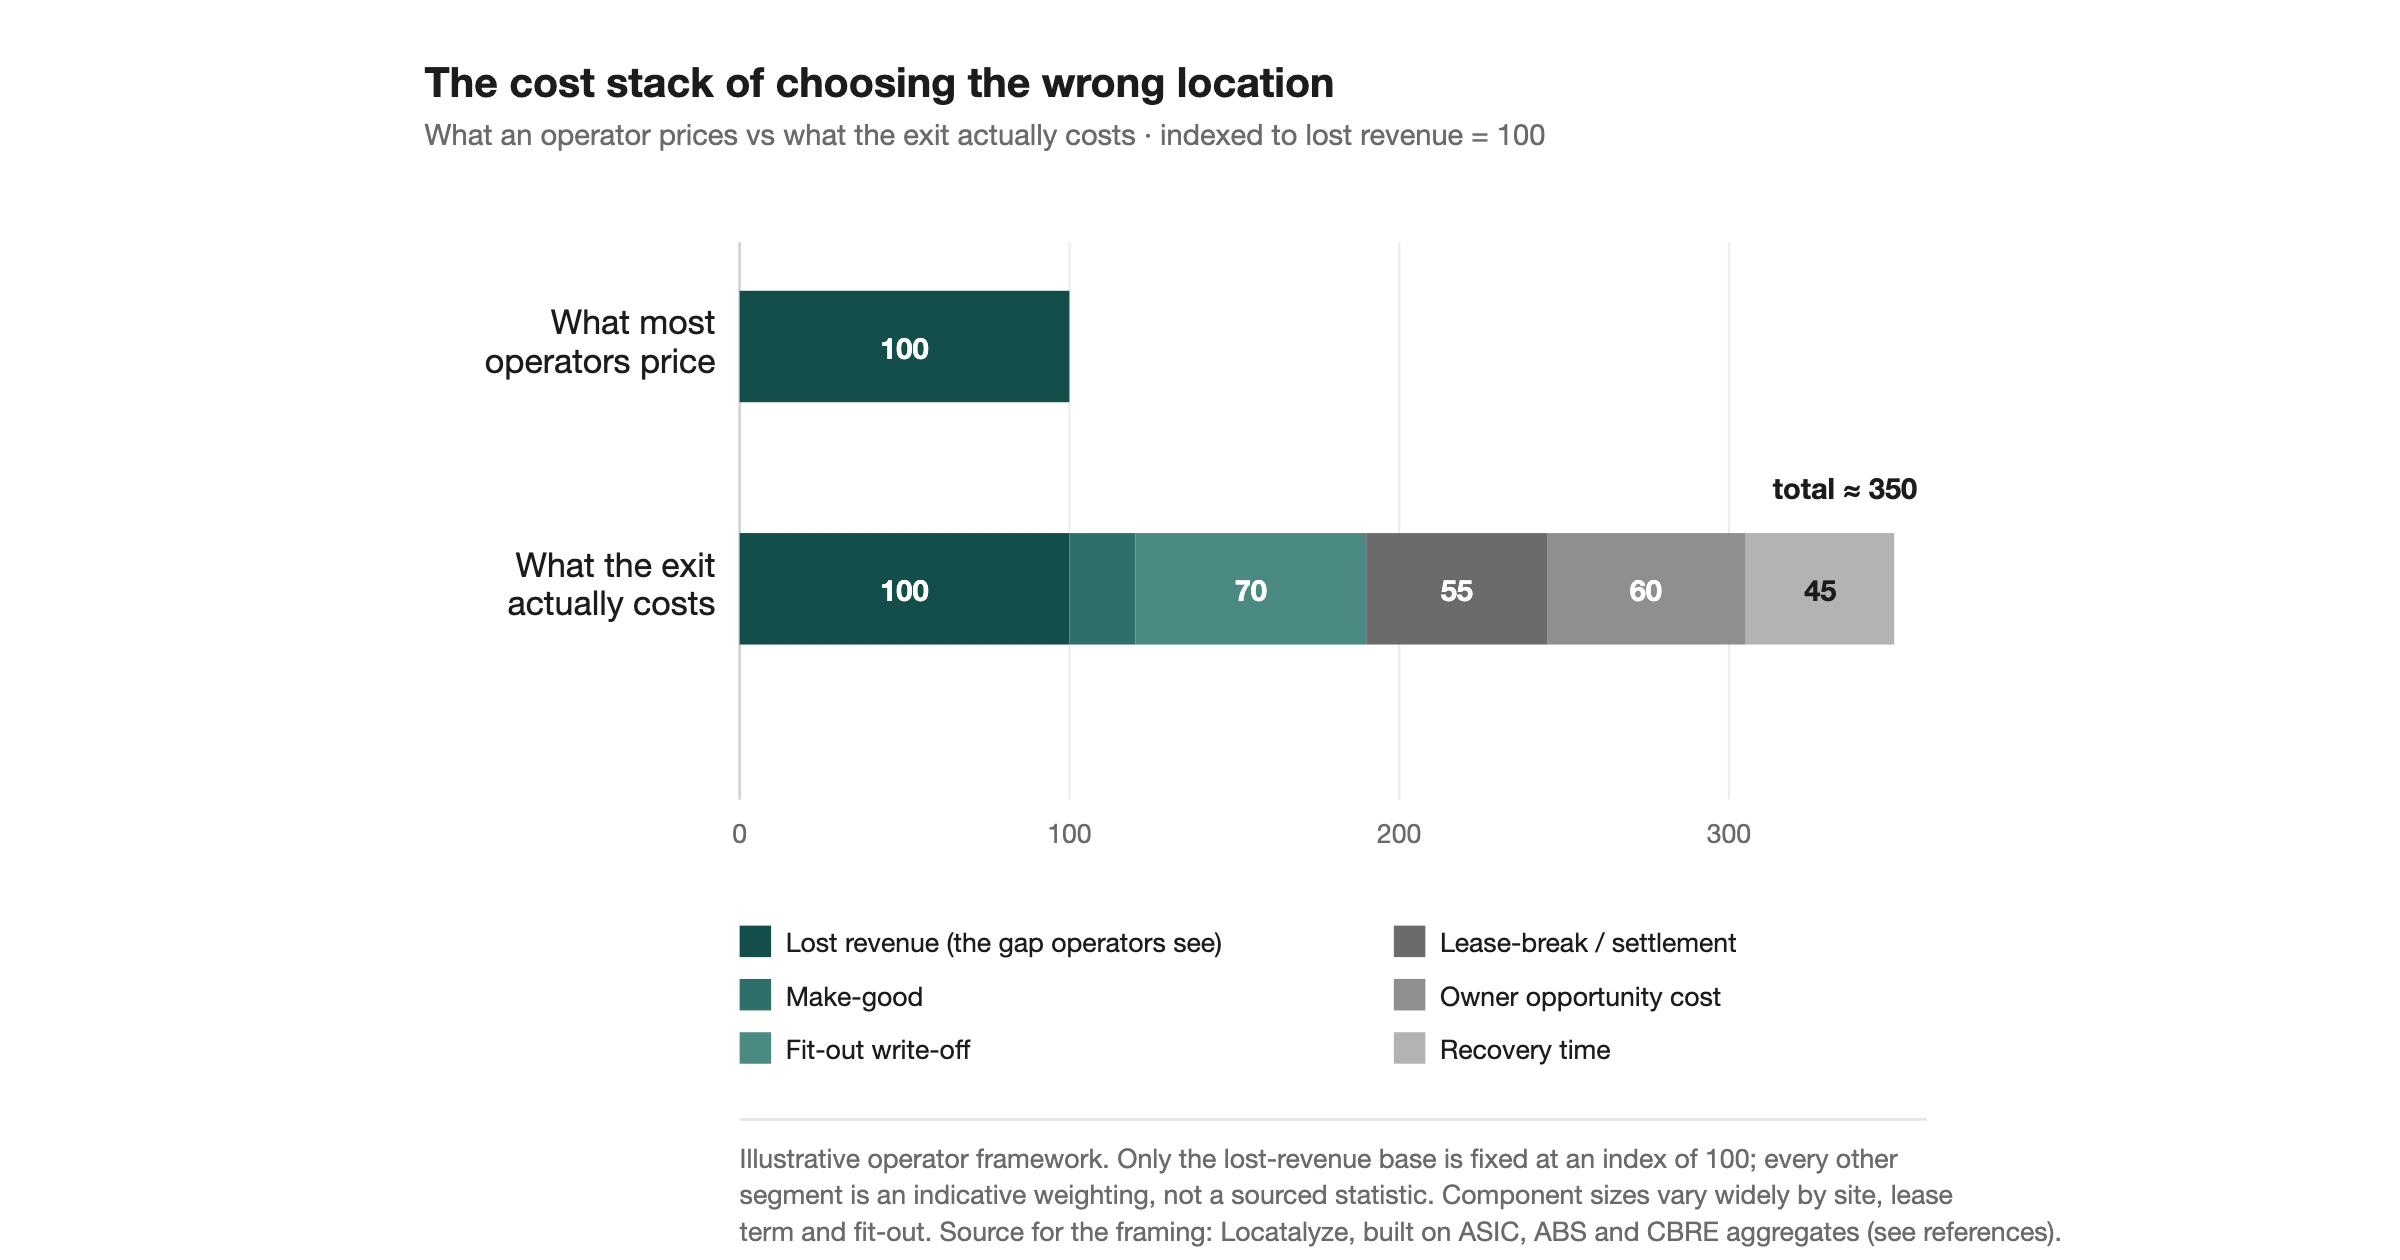
Then there is the gap between the rent quoted and the rent paid, which is the chart at the top of this piece. Landlords compete on incentive, not headline rent, so the face rent on the lease overstates the real cost. CBRE put super-prime CBD retail incentives at about 20 per cent in the second quarter of 2025, down from 27.5 per cent a year earlier, with net effective rent up 10.3 per cent year-on-year (CBRE, Australian Retail Figures, Q2 2025). A face rent quoted with a 20 per cent incentive is worth roughly 80 cents in the dollar over the term once the incentive is amortised. Comparing two sites on face rent alone compares the wrong number. The detail of how net effective rent is built sits in the reference on commercial rent per square metre across Australia.
The failure mode is signing the landlord's first draft. A ratchet that should be void, a make-good obligation no one priced, a face rent accepted without the incentive negotiated — each one is a cost the market would have let you avoid, conceded because the tenant did not know the clause was negotiable.
Amateur versus professional retail site selection
The seven metrics are easy to nod along to and hard to apply, because the difference between checking one and checking it properly is rarely visible until the lease is signed. The matrix below sets the superficial version of each metric against the proper version, anchored to the specific data and law each one rests on.
The pattern down the right-hand column is consistent. Proper evaluation moves to a finer geographic scale, swaps a static snapshot for a directional signal, and treats the lease as negotiable rather than fixed. None of it requires proprietary data. The census geography, the business counts, the building approvals and the leasing statutes are all public. What they require is the discipline to look them up for the specific site rather than reason from the suburb's reputation.
What this framework does not cover
This is a screening framework, and it is honest about its limits. Two of the seven metrics rest on rule-of-thumb and theory rather than hard published statistics, and they should be weighted accordingly. The rent-to-revenue bands are an industry convention, useful as a sanity check and not a law of nature; the citable Australian anchors around them are practitioner and commercial sources, not government data. Accessibility is assembled from several inputs with no single authoritative metric behind it, so it carries more judgement than the census-based metrics do.
The framework also does not value the things no dataset captures: the quality of the operator, the strength of the offer, the timing of the cycle, and the specific terms of the deal beyond rent and make-good. A great operator can carry a mediocre site and a weak operator can waste a great one. The metrics narrow the field and flag the avoidable mistakes; they do not pick the winner. Nor do they substitute for legal advice on the lease or accounting advice on the model — the leasing law cited here is summarised, not advice, and statutes are amended. Treat every sourced figure as dated to its release and refresh it before you rely on it.
What to do with this
The practical move is to run all seven, in order, and to stop early when a site fails one badly. An occupancy cost that only works on the landlord's optimistic revenue is a no before you reach demographics. A catchment that collapses on the wrong side of an arterial is a no before you reach the lease. The value of the checklist is as much in the sites it lets you reject cheaply as in the one it lets you sign with confidence. Most operators lose money not by signing a bad lease but by spending months courting a site that one properly-checked metric would have killed in an afternoon.
For a specific address, the same seven can be assembled from public data — or you can have them compiled and stress-tested for you.
Analyse your address →You can also read how the metrics play out market by market for Sydney, Melbourne and Brisbane. The operators who last are not the ones who found a secret suburb. They are the ones who checked seven things while the applicant beside them checked three.
Methodology footnote
Sourced figures: occupancy-cost ranges for sub-450 sqm specialty stores from LeaseInfo (2024); census geography (SA1 200–800 residents, SA2 3,000–25,000) from the ABS Australian Statistical Geography Standard, Edition 3, applied to the 2021 Census; business counts (2,729,648 actively trading at 30 June 2025; 2,463 SA2 regions) from ABS Counts of Australian Businesses, 2021–2025; building approvals (17,300 dwellings, −10.5% seasonally adjusted, March 2026, released 11 May 2026) from ABS Building Approvals, Australia; leasing provisions from the Retail Leases Act 1994 (NSW) s 18, the Retail Leases Act 2003 (Vic) s 35, and Aldi Foods v Northcote Plaza [2024] VSC 799; make-good guidance from the Victorian Small Business Commission; incentive (~20%, Q2 2025) and net effective rent movement (+10.3% YoY) from CBRE Australian Retail Figures, Q2 2025; reused reference points from CBRE Australian Retail Figures Q2 2023 and Cushman & Wakefield Main Streets Across the World 2025. Framework and rule-of-thumb elements: the 8–12% / 6–10% rent-to-revenue bands (industry convention), the Huff (1964) gravity model and distance decay (academic theory), and accessibility scoring (composite judgement). Figures are dated to release and should be refreshed before reuse.
Frequently asked questions
What rent-to-revenue ratio is safe?
There is no single safe number, but a working rule-of-thumb is that hospitality occupancy cost above roughly 10 to 12 per cent of revenue, and retail above roughly 8 to 10 per cent, starts to squeeze margin. Australian hospitality practitioners flag rent above about 10 per cent of net revenue as a danger line (Cafe Bookkeepers, AU), while shopping-centre specialty stores under 450 sqm commonly run 10 to 20 per cent because of marketing levies and outgoings (LeaseInfo, 2024). Compute the ratio on a conservative revenue estimate, not the landlord's, and treat the bands as a sanity check rather than a target.
What is a ratchet clause?
A ratchet clause is a lease provision that prevents the rent from falling at a review, so the rent can only stay the same or rise even when the market rate has dropped. In New South Wales and Victoria these are largely unenforceable: the Retail Leases Act 1994 (NSW) s 18 makes ratchet clauses void, and the Retail Leases Act 2003 (Vic) s 35 voids any provision to the extent it precludes a rent reduction. Aldi Foods v Northcote Plaza [2024] VSC 799 confirmed that a cap on a review is permitted, but a ratchet or collar that stops the rent decreasing is not.
What is the difference between face rent and net effective rent?
Face rent is the headline rent quoted in the lease. Net effective rent is what the tenant actually pays once the landlord's incentive — a rent-free period, a fit-out contribution or similar — is amortised across the term. The gap can be large: CBRE put super-prime CBD retail incentives at about 20 per cent in Q2 2025 (CBRE, Australian Retail Figures, Q2 2025), so a face rent with that incentive is worth roughly 80 cents in the dollar. Always compare sites on net effective rent, never on face rent.
What is make-good and why does it matter?
Make-good is the tenant's obligation at the end of a lease to return the premises to an agreed condition — which can mean removing the fit-out, repairing damage beyond fair wear and tear, and restoring the start-of-lease state (Victorian Small Business Commission). It is a real and often large cost that operators forget to budget. If a landlord agrees there is no make-good obligation, get it in writing, because a verbal assurance carries no weight at the end of the term.
References
Australian Bureau of Statistics, Australian Statistical Geography Standard (ASGS) Edition 3, 2021 Census. <a href="https://www.abs.gov.au" rel="noopener" target="_blank">abs.gov.au</a>
Australian Bureau of Statistics, Counts of Australian Businesses, including Entries and Exits, 2021–2025. <a href="https://www.abs.gov.au" rel="noopener" target="_blank">abs.gov.au</a>
Australian Bureau of Statistics, Building Approvals, Australia (March 2026, released 11 May 2026). <a href="https://www.abs.gov.au" rel="noopener" target="_blank">abs.gov.au</a>
Retail Leases Act 1994 (NSW) s 18. <a href="https://legislation.nsw.gov.au" rel="noopener" target="_blank">legislation.nsw.gov.au</a>
Retail Leases Act 2003 (Vic) s 35. <a href="https://www.legislation.vic.gov.au" rel="noopener" target="_blank">legislation.vic.gov.au</a>
Aldi Foods v Northcote Plaza [2024] VSC 799.
Victorian Small Business Commission, make-good guidance. <a href="https://www.vsbc.vic.gov.au" rel="noopener" target="_blank">vsbc.vic.gov.au</a>
CBRE, Australian Retail Figures, Q2 2025 (incentives, net effective rent). <a href="https://www.cbre.com.au" rel="noopener" target="_blank">cbre.com.au</a>
CBRE, Australian Retail Figures, Q2 2023 (super-prime CBD net face rents). <a href="https://www.cbre.com.au" rel="noopener" target="_blank">cbre.com.au</a>
Cushman & Wakefield, Main Streets Across the World, 2025. <a href="https://www.cushmanwakefield.com" rel="noopener" target="_blank">cushmanwakefield.com</a>
LeaseInfo, shopping-centre specialty occupancy costs, 2024 (commercial source).
Cafe Bookkeepers, AU, hospitality rent-to-revenue guidance (practitioner source).
Huff, D.L. (1964), "Defining and Estimating a Trading Area", Journal of Marketing (gravity-model framework).
About the author
Locatalyze Research Team
Location intelligence, Locatalyze
The Locatalyze research team builds the location-scoring models behind the platform and writes up what the data shows for Australian operators.
Tools first — then a full report for your address
Free rent, viability, and break-even checks. Upgrade when you are ready for competitors, map, and numbers for a specific site.
No signup required for tools