Commercial Rent Affordability Australia: Test All-In Occupancy Against Revenue
Founder, Locatalyze
Affordability is not ‘cheap rent’. It is all-in occupancy cost against revenue the site can actually support. Use this page as a decision framework alongside the [commercial rent per sqm reference](/blog/commercial-rent-per-sqm-australia) and ATO coffee-shop rent÷turnover bands — then model your own ticket, labour and ramp. Every worked example below is a MODEL unless tied to a named primary source.
Evidence standard
FACT: ATO coffee-shop small-business benchmarks for the 2023–24 tax year publish observed rent÷turnover ranges by turnover band (opened for Locatalyze articles 29 Aug 2026). FACT: public CBD/centre rent anchors live in the [commercial rent per sqm guide](/blog/commercial-rent-per-sqm-australia) (CBRE / Colliers / C&W vintages labelled there). Calculator outputs, ‘maximum affordable rent’ arithmetic, and worked examples on this page are MODELS / ILLUSTRATIVE — not a valuation and not a census of lease outcomes. LOCATALYZE ANALYSIS: refuse leases that only clear at heroic utilisation or year-three hope.
10–17%
ATO coffee-shop rent÷turnover — $65k–$250k annual turnover (2023–24)
8–14%
ATO coffee-shop rent÷turnover — $250k–$600k turnover (2023–24)
6–10%
ATO coffee-shop rent÷turnover — above $600k turnover (2023–24)
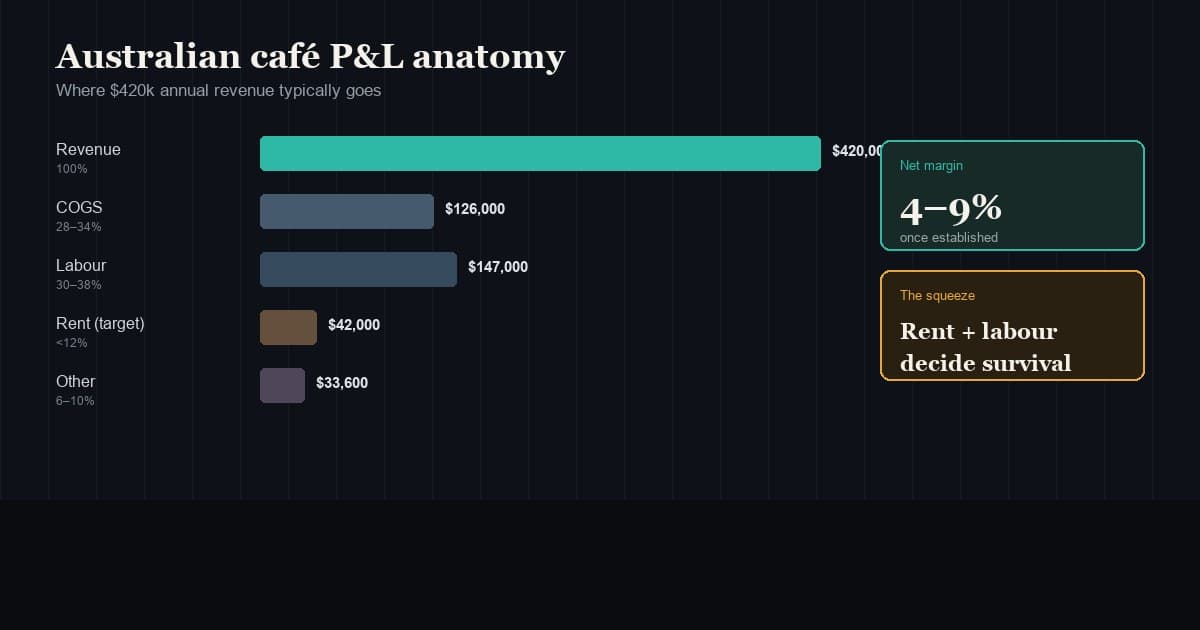
Those ATO ranges are observed tax-return ratios for coffee shops, not recommended targets and not automatic all-in occupancy after outgoings and incentives. For restaurants, retail and gyms there is no single official national rent÷turnover table in this article — use the same arithmetic with your format’s margins, and treat any ‘8–12% healthy’ folklore as an industry conversation starter, not FACT.
What ‘affordable’ actually means
A $3,000/month rent is crippling at $15,000/month revenue and comfortable at $50,000. Absolute dollars are almost useless without a revenue ceiling you can defend from dayparts and catchment. LOCATALYZE ANALYSIS: underwrite face rent + outgoings − incentives as all-in occupancy, then divide by a conservative monthly revenue — not the landlord’s brochure or your best Saturday.
The affordability test (MODEL)
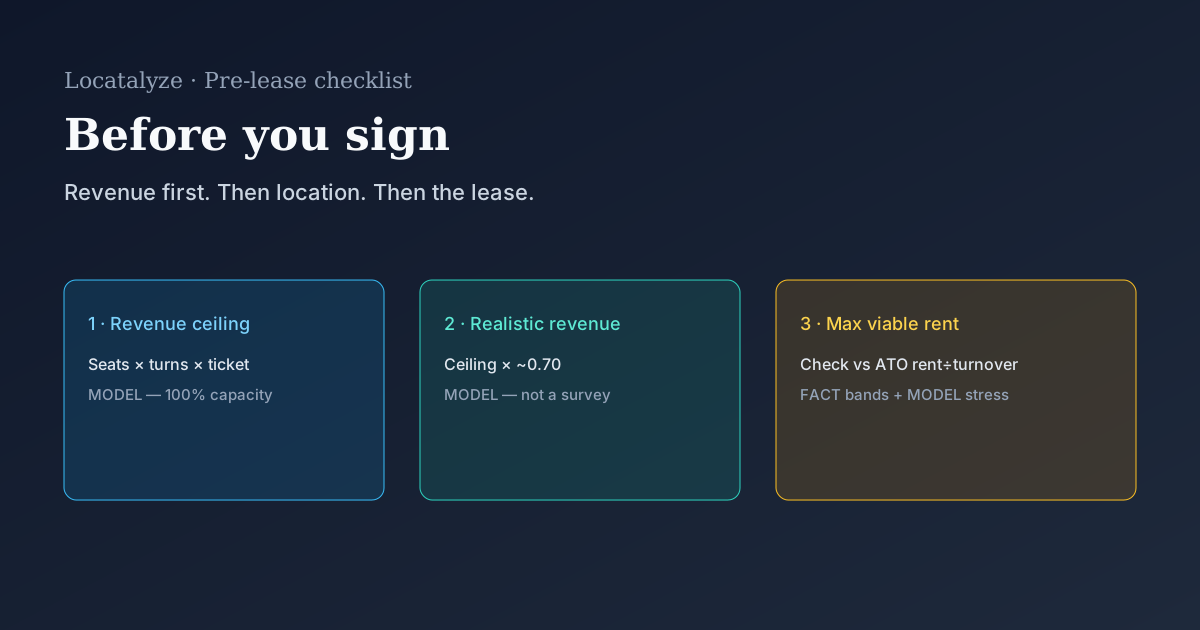
Five steps before you negotiate
- 1
Estimate conservative monthly revenue from counted dayparts × realistic capture × average ticket (label every input).
- 2
Compute all-in monthly occupancy: face rent + outgoings − amortised incentive / rent-free.
- 3
Occupancy ÷ revenue = occupancy load. For coffee shops, place the rent component against the matching ATO size band as a sanity check.
- 4
Stress-test ramp: MODEL many openings at 40–70% of mature revenue for 3–6 months while fixed rent continues.
- 5
If the lease only works at peak utilisation every day, treat as VERIFY or AVOID — not PROCEED.
MODEL: café underwriting (inner suburb)
Assumptions (illustrative): peak-hour passers ~120/hr for 2 peak hours; capture 3% of those peak hours only; 5 quieter hours at half the peak capture; average ticket $11.50; 26 trading days. Peak hour transactions ≈ 120 × 0.03 × 2 = 7.2 Quieter hours ≈ 60 × 0.03 × 5 = 9 ≈ 16 transactions/day × $11.50 ≈ $184/day → ~$4,780/month. At 10% occupancy load, all-in rent budget ≈ $478/month. At 14% (top of ATO mid-band for a small café), ≈ $669/month. If the asking all-in is $3,500/month, required revenue at 10% load is $35,000/month — roughly 7× this conservative count. That is not a negotiation gap; it is a different business. Treat as AVOID unless you can prove a much higher counted demand.
Translate ATO bands into weekly language
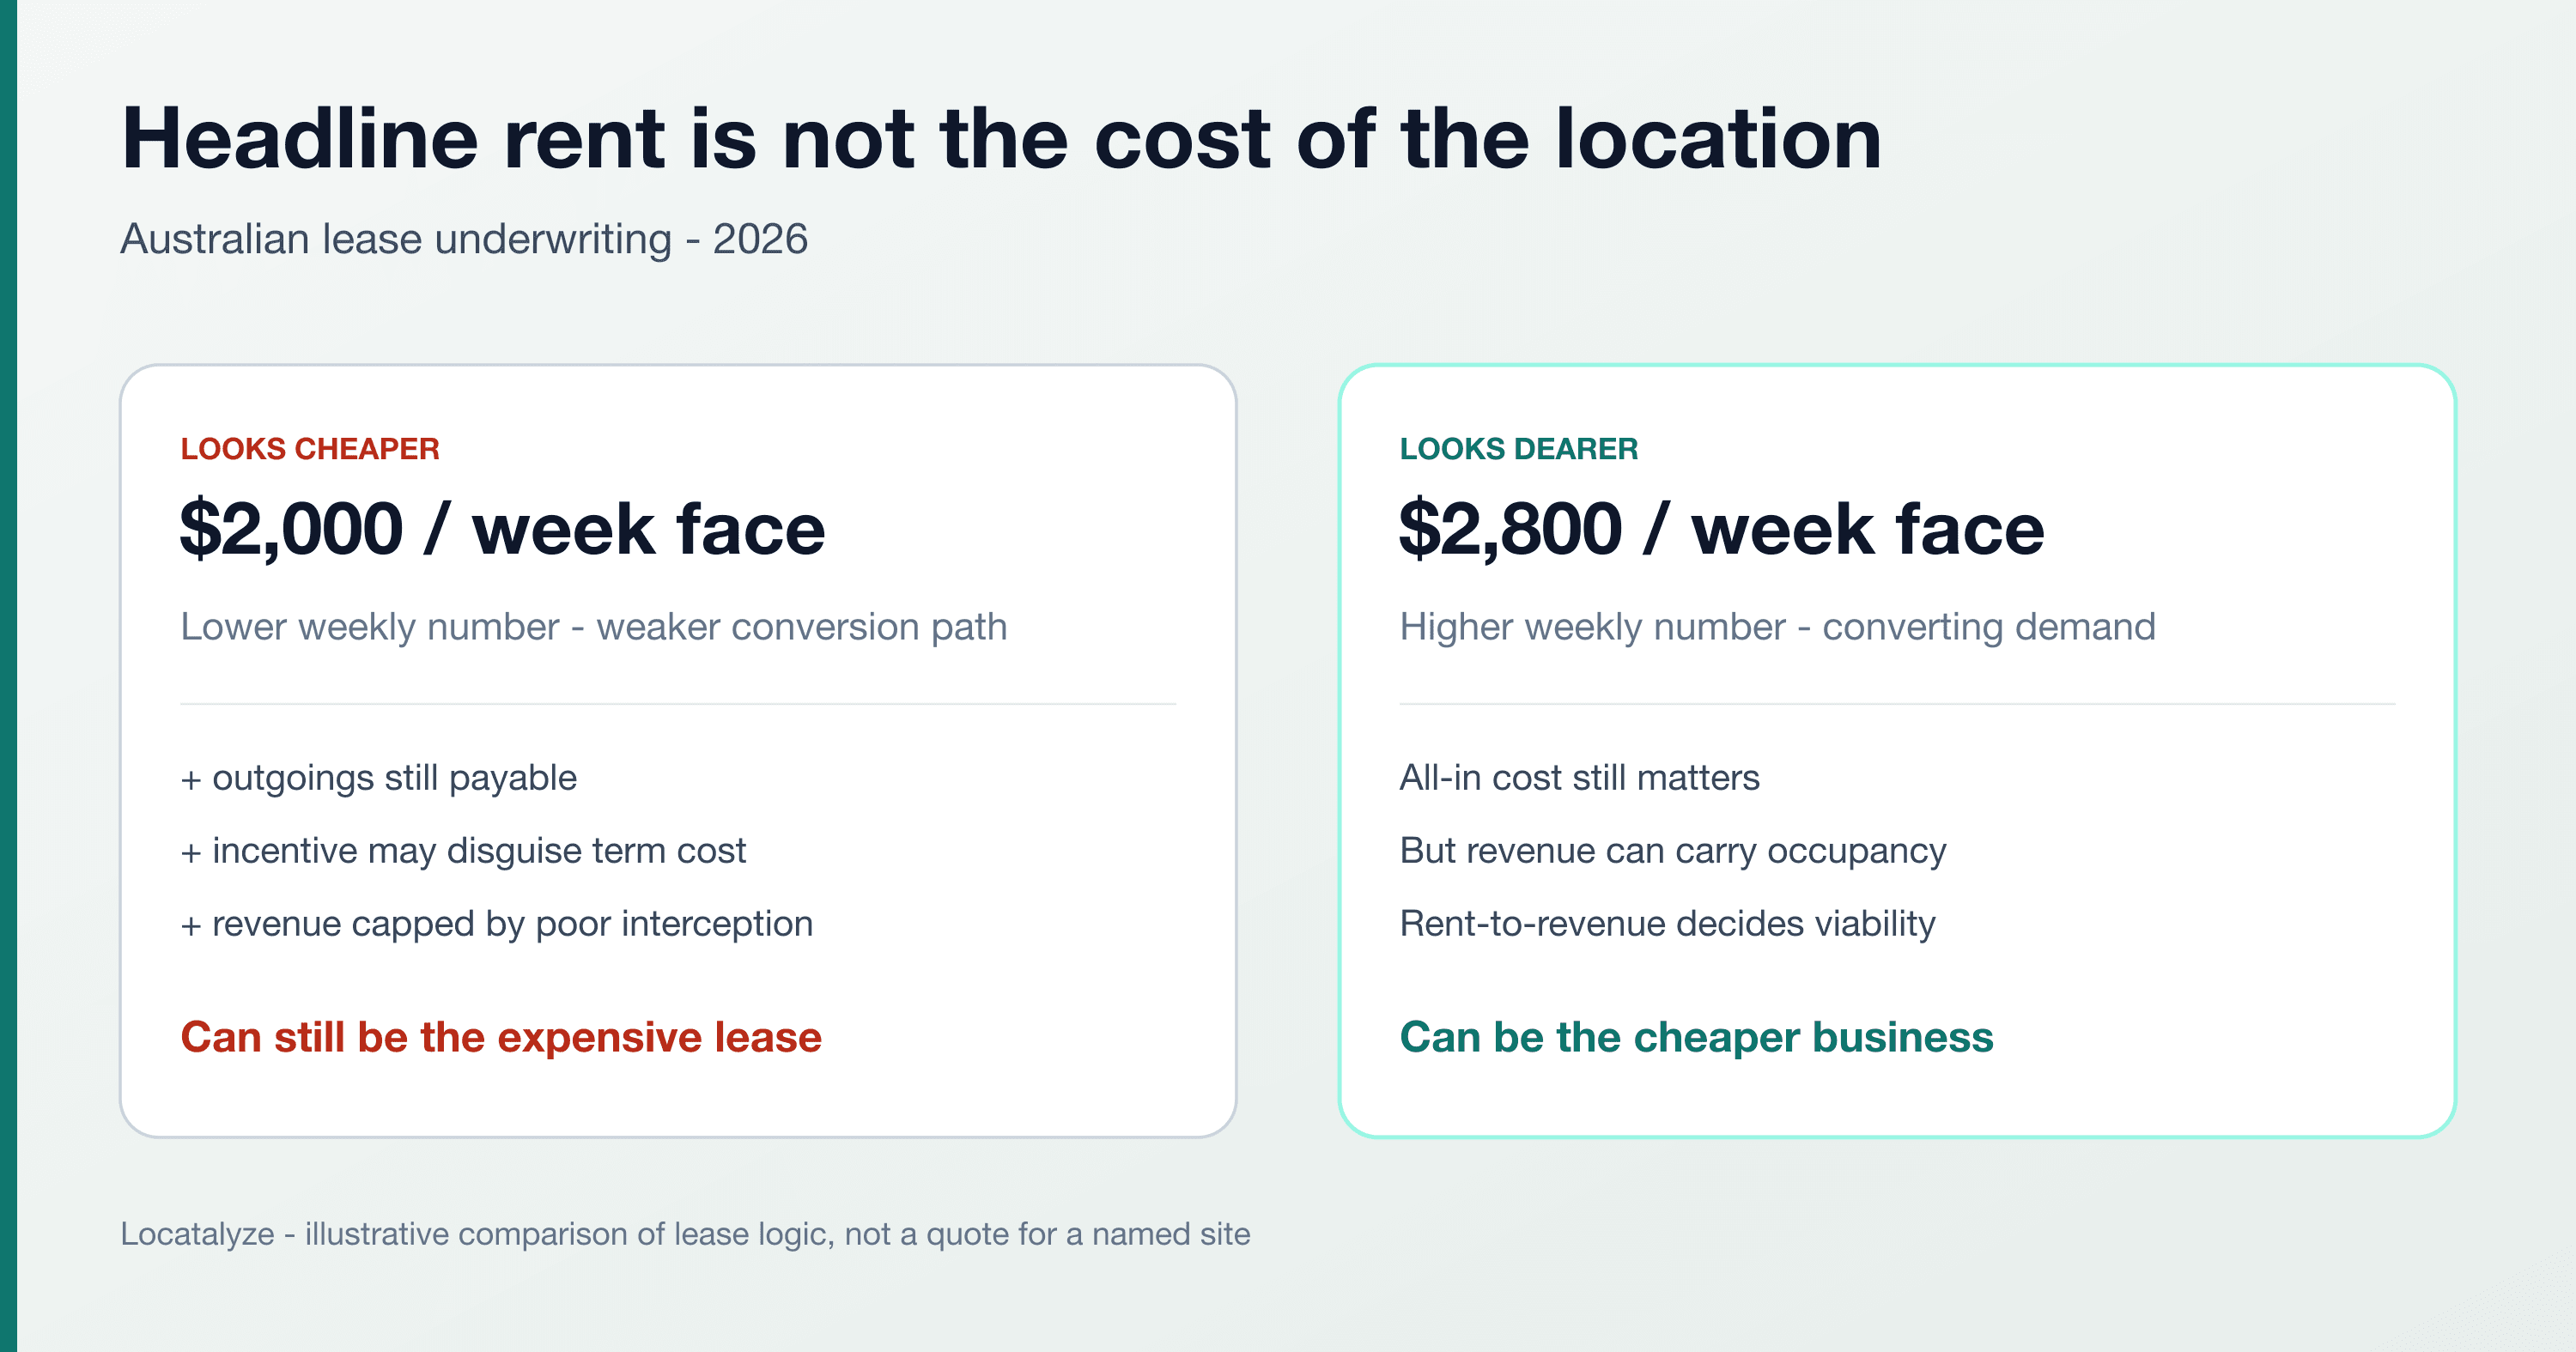
FACT (ATO coffee shops, 2023–24): at $400,000 annual turnover, the 8–14% rent range implies roughly $32,000–$56,000 of annual tax rent expense — about $615–$1,077 per week if you divide by 52. That translation is a rough mirror only. Your all-in occupancy may sit above tax ‘rent’, and your realistic turnover may not be $400,000. If the landlord’s all-in ask is $2,400/week (~$125,000/year), you need roughly $890,000–$1.5 million annual turnover to land inside an 8–14% band. Most first-time suburban cafés do not live in that world. Full walkthrough: why a cheaper lease can be more expensive.
Where to get $/sqm anchors (not a fake national table)
This page deliberately does not invent a CBD / inner / outer $/m² table by category. Public anchors that have been opened for Locatalyze’s rent guide — CBRE, Colliers, Cushman & Wakefield, with vintages — sit in commercial rent per sqm Australia. Use those as brackets, then verify the specific listing with outgoings and incentives in writing.
Lease structure moves the true cost
True-cost checklist (operator practice)
Base rent + estimated outgoings = gross occupancy before incentives. Rent-free / landlord contribution: amortise over the committed term. Annual increase: CPI vs fixed % — model year 3, not only year 1. Make-good and fit-out: capital that must be recovered from residual. Personal guarantee and break clause: change the downside, not the face rent. Clause-level detail: [before you sign that lease](/blog/before-you-sign-that-lease-checklist-restaurant).
PROCEED / VERIFY / AVOID (LOCATALYZE ANALYSIS)
Affordability is address-specific. Model the rent against the frontage you actually have.
Free location score, map, data confidence and PROCEED / VERIFY / AVOID recommendation. Modelled financials stay optional.
Analyse this addressSources & verification
Related reading
The calculators
You don't have to do this arithmetic by hand. Locatalyze runs three free calculators built on exactly the framework this page explains — no signup: the rent overpriced checker tests an asking rent against category benchmarks for your suburb, the break-even foot traffic calculator turns a rent figure into the daily customer count it demands, and the business viability checker runs the full affordability screen in one pass. The rest of this page explains the method behind them, so you can sanity-check what they tell you.
Run this calculation on a real address
The free tools use category benchmarks. A full Locatalyze analysis prices the actual rent envelope for a specific address, models the realistic revenue its foot traffic supports, and returns a PROCEED / VERIFY / AVOID recommendation with the break-even maths shown.
Analyse an addressFrequently asked questions
About the author
Prashant GuleriaFounder, Locatalyze
Prashant writes lease economics for Australian operators — labelled models where industry averages are thin or gated.
Tools first — then a full report for your address
Free rent, viability, and break-even checks. Upgrade when you are ready for competitors, map, and numbers for a specific site.
No signup required for tools