Why a Cheaper Lease Can Be the More Expensive Location
Founder, Locatalyze
The offer that feels safe is often the lower weekly number. Agents know this. So do tired founders who have already fallen for a fit-out. But a lease is not cheap because the face rent is lower than the shop across the road. A lease is cheap only if the all-in occupancy cost — rent, outgoings and the true value of any incentive — can be carried by the revenue that address can realistically produce. In 2026, with incentives compressing on stronger retail stock, the “bargain” is more likely to sit on weaker demand. That is how a cheaper lease becomes the more expensive location.
Evidence standard
Sourced facts in this guide come from the Australian Taxation Office coffee-shop benchmarks (2023–24 tax year, page opened 29 Aug 2026) and Colliers’ Australian Retail Snapshot for Q2 2026 (incentive compression and rental growth). Worked lease figures are labelled illustrative arithmetic — not named businesses, not observed comps. Face-versus-effective rent mechanics are summarised here and detailed in our commercial rent per sqm reference. No unsupported national “average café rent” is invented.
The weekly number is a sales tool. The ratio is the underwrite.
Australian operators still compare leases the way people compare hotel room rates: the smaller dollar wins. That habit survives because the offer sheet leads with face rent, because inspection days feel emotional, and because solicitors are paid to clean legal risk, not commercial risk. None of that answers the only question that decides survival: what share of realistic turnover will this occupancy cost consume before coffee, labour and everything else has to fit underneath?
That share is the occupancy ratio — all-in occupancy cost divided by realistic revenue for the same period. It is Locatalyze analysis, not a government formula, but it is the cleanest way to stop two unlike offers from being compared as if they were the same product. A $2,000-per-week face rent on a dead interception path can be dearer than a $2,800-per-week face rent on a converting strip, even before you argue about fit-out quality.
A lease is not cheap because the weekly figure is lower. It is cheap only if realistic revenue can carry the all-in cost.
What changed in 2026: incentives are tighter on stronger stock
Colliers’ Australian Retail Snapshot for Q2 2026 describes a leasing regime that should change how you read a “cheap” offer. National retail rents continued to strengthen on limited new supply, elevated occupancy and resilient tenant demand. Regional centres recorded about +2.5% annual gross face rental growth; sub-regionals about +3.1%; neighbourhood centres about +2.9%; large-format retail led at about +6.4% year on year. Across most retail classes, incentives compressed. Colliers reports national incentives declining by an average of 280 basis points, reflecting stronger landlord pricing power.
Read that carefully. It is shopping-centre and retail-asset research, not a table of 70-square-metre strip café deals. The operator implication is still direct. When landlords can tighten incentives on stronger assets, the remaining soft packages — long rent-free periods, heavy fit-out contributions, low face rent relative to neighbours — concentrate where demand is harder to sell. In a tightening market, a fat incentive is often a signal about the site, not a free gift from a generous landlord.
280 bp
Average national retail incentive compression reported by Colliers, Q2 2026
+2.5% to +3.1%
Approx. annual face rental growth, regional to sub-regional centres (Colliers Q2 2026)
2023–24
ATO coffee-shop rent-to-turnover vintage used below (tax year, not a 2026 lease quote)
Inference — not a Colliers quote
Colliers does not publish a national “bargain strip shop” series in that snapshot. Locatalyze’s inference is commercial: when prime incentives tighten, soft packages migrate toward weaker demand. Treat any outsized incentive as a VERIFY trigger, not as proof the location is underpriced in your favour.
Build all-in occupancy before you compare anything
Face rent is the headline. Outgoings are the second bill. Incentives are the discount that must be spread across the term before you celebrate. Our commercial rent per square metre reference walks the gross-versus-net and face-versus-effective mechanics in detail. The short version for underwriting is enough here.
Minimum written schedule before comparison
- 1
Face rent — weekly and annual, and whether the quote is gross or net.
- 2
Outgoings estimate — rates, insurance, services, promotional levy, and who pays what.
- 3
Incentive — rent-free months, fit-out contribution, stepped rent, and the exact conditions attached.
- 4
Lettable area — the area you can actually trade from, not a marketing gross-up.
- 5
Term and options — because amortising a contribution over three years is not the same as amortising it over seven.
Then convert the package into one all-in occupancy cost per week (or per year) after spreading the incentive across the committed term. Only that number is comparable across a centre deal, a strip net lease and a “cheap” secondary shop with six months free. Comparing face rents alone is how operators accidentally buy the expensive location.
A concrete amortisation example — still labelled arithmetic, not a market rent. Suppose face rent is $2,600 per week net, outgoings are quoted at $420 per week, and the landlord offers four months rent-free on a five-year term with no clawback during the free period. Face-plus-outgoings while paying is $3,020 per week. Over five years there are 260 weeks; sixteen weeks are free of face rent but outgoings may still apply depending on the clause — verify that in writing. If outgoings continue during the rent-free period, cash occupancy across the term is not “$2,600 forever discounted by 4/60.” Spread the face-rent holiday across 260 weeks and keep outgoings honest. Operators who treat rent-free as a permanent $2,600 site discover the real bill in month five.
Fit-out contributions need the same discipline. A $80,000 contribution looks like a gift until you amortise it over the committed term, read the make-good, and check whether early exit triggers repayment. The contribution can still be rational. It cannot be entered into the model as free capital that never has to be earned back through trading.
What the ATO ranges actually tell you
The Australian Taxation Office publishes small-business performance benchmarks for coffee shops using information reported on tax returns for the 2023–24 financial year — the most current set on the page when opened on 29 August 2026. For rent expenses divided by annual turnover, the published ranges are:
Three caveats matter more than the percentages. First, the ATO says cost of sales to turnover is the key benchmark for coffee shops; rent is an “other” benchmark. Second, “rent” on a tax return is not automatically identical to your all-in occupancy cost after outgoings and incentive accounting. Third, these are observed ranges across many businesses, not a green light to sit at the top of the band on a weak site.
Used properly, the table is a sanity check. If your all-in occupancy needs 18% of a realistic mid-band turnover to clear, you are outside the ATO-observed rent band for that size — and you still have food, labour and everything else to fund. That is why our café failure analysis treats rent-to-revenue as arithmetic that must be solved before enthusiasm, not after fit-out quotes.
Translate the mid band into weekly language so the offer sheet stops feeling abstract. At $400,000 annual turnover, the ATO 8–14% rent range implies roughly $32,000–$56,000 of annual rent expense in tax terms — about $615–$1,077 per week if you naively divide by 52. That translation is a rough mirror only: your all-in occupancy may sit above tax “rent,” and your realistic turnover may not be $400,000. The exercise is still useful. If the landlord’s all-in ask is $2,400 per week, you are looking for around $125,000 per year of occupancy cost — which needs roughly $890,000–$1.5 million of annual turnover to land inside an 8–14% rent-to-turnover band. Most first-time suburban cafés do not live in that turnover world. The maths forces the conversation back to whether the address can produce the revenue, not whether the weekly figure “feels manageable.”
Illustrative arithmetic: cheaper face, dearer business
Labelled model — not a case study
The weekly figures below are illustrative. They are not comps from a named street and not a claim about what “typical” Australian cafés pay. Change the revenue assumptions to your counted numbers. The point is the ratio, not the dollars.
Lease A offers a lower all-in occupancy cost: $2,200 per week after outgoings and a modest incentive amortisation. Lease B costs $3,000 per week all-in. On the offer sheet, A wins. Now attach revenue that the sites can actually support after counting — not after hoping.
Lease A is cheaper on paper and more expensive as a business. Lease B is dearer on paper and closer to an occupancy load that leaves room for the rest of the cost stack. If Lease A’s revenue assumption is optimistic — a quiet side street counted on a sunny Saturday only — the ratio worsens further. That is the entire argument of this guide in one table.
The ratio only works with revenue the address can support. Test the exact shopfront before you negotiate from a weekly face rent.
Free location score, map, data confidence and PROCEED / VERIFY / AVOID recommendation. Modelled financials stay optional.
Analyse this addressWhy the cheap shop is often cheap
Landlords do not randomly discount good demand. Soft pricing usually prices in something you can observe if you look: weak interception from the true pedestrian desire line, a one-sided daypart, a centre tenancy buried off the circuit, parking friction, a competitor already capturing the habitual trip, or a street that looks busy while converting poorly. Our note on high foot traffic and low sales is the companion piece for that failure mode.
The 2026 incentive story sharpens the same point. When Colliers reports incentives compressing nationally on stronger retail stock, the remaining soft packages are less likely to be “the market being kind” and more likely to be compensation for weaker trade. A six-month rent-free period can still be rational — if you amortise it honestly and the base case works from month seven without pretending the free period is permanent revenue. It is a VERIFY item, not a PROCEED signal on its own.
Common ways a low face rent hides cost
None of this means every discounted lease is a trap. Population growth corridors, centres mid-refurbishment, and landlords clearing a long vacancy can produce temporarily soft packages on sites that will trade. The discipline is identical: write the all-in cost, count the present customer path, and refuse to put unfinished works into year-one revenue. That is the same timing logic we use in location investigations such as the Maroochydore City Centre guide — future story in the upside case, open evidence in the base case.
PROCEED / VERIFY / AVOID
PROCEED
When all-in occupancy is documented in writing, incentive is amortised over the real term, and counted revenue — not capacity fantasies — keeps the occupancy ratio inside a defensible band for your format and size. Prefer sites where the customer path is observable without needing a future development to arrive.
VERIFY
When face rent looks unusually low against nearby offers; when the incentive is large relative to term; when outgoings are “about” rather than scheduled; when the agent sells future anchors; when your model only works at Saturday peak. Count midweek. Read the incentive clauses. Recalculate the ratio at 70% of your realistic case.
AVOID
Signing because the weekly number is lower than the last shop you liked. Underwriting on face rent alone. Treating ATO ranges as a target to stretch toward. Assuming a rent-free period proves the location is strong. Using year-three hope to justify year-one occupancy.
A short underwriting protocol before you fall for the fit-out
Do this before heads of agreement harden
- 1
Write the all-in weekly occupancy cost from a landlord schedule, not from a conversation.
- 2
Amortise every incentive across the committed term and note clawbacks.
- 3
Estimate realistic weekly revenue from counted dayparts — Tuesday, Thursday, Saturday — not from a single busy inspection.
- 4
Compute occupancy ratio at that realistic revenue and again at 70% of it.
- 5
Place the rent component against the relevant ATO size band as a sanity check, remembering it is observed tax data from 2023–24, not a 2026 quote.
- 6
Only then compare two sites. The cheaper lease is the one with the better ratio under honest revenue — not the lower face rent.
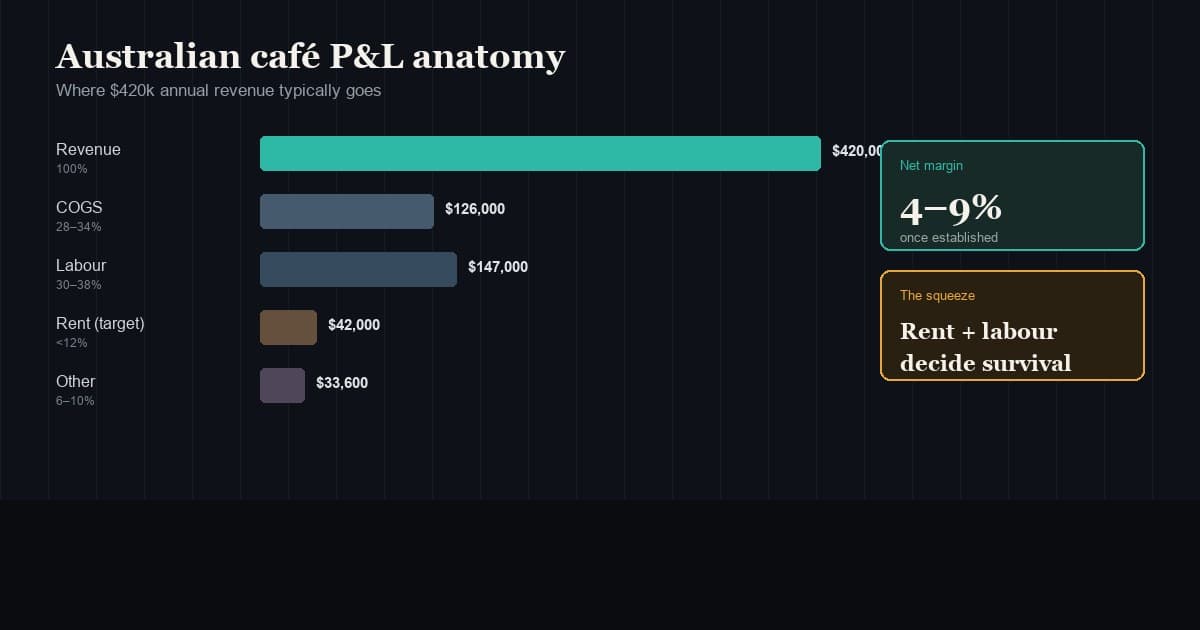
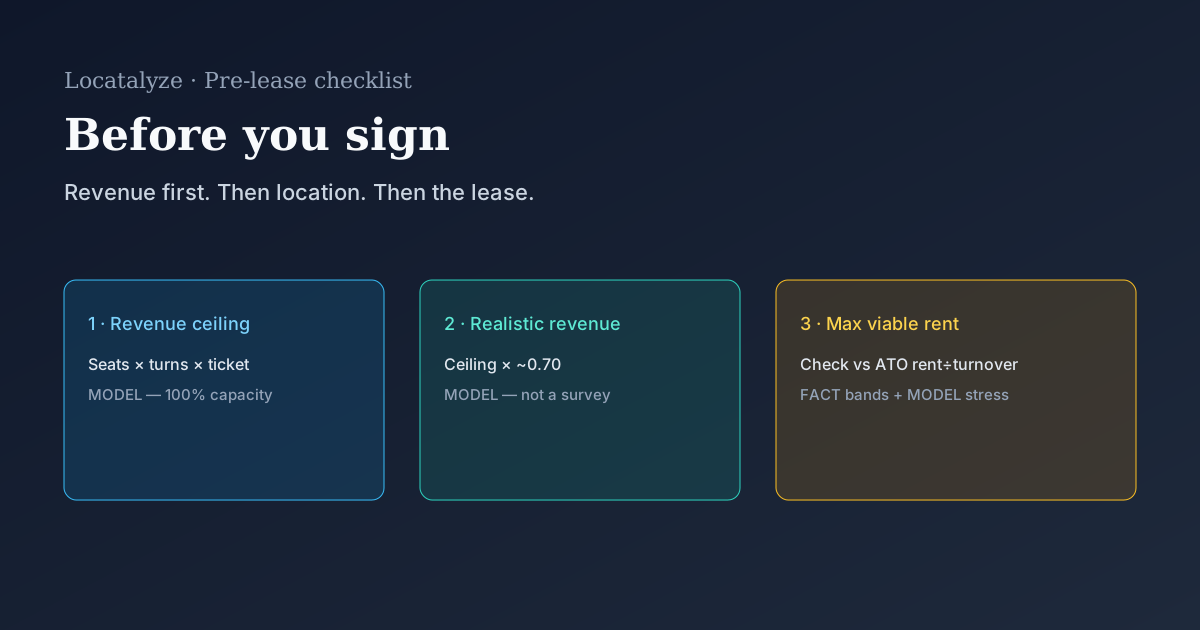
If you want the full commercial checklist around this arithmetic — capacity ceilings, solicitor boundaries, and negotiation sequencing — use Before You Sign That Lease. If you need the P&L context for how little margin remains after rent, labour and COGS, see coffee shop profitability in Australia.
The decision rule
Stop asking which lease is cheaper. Ask which location produces the lower occupancy load after honest revenue. In a 2026 market where Colliers shows incentives compressing on stronger retail stock, soft pricing deserves more suspicion, not less. The ATO ranges tell you what rent-to-turnover has looked like across coffee shops in tax data — not what your strip will pay, and not that the top of the band is safe.
The expensive location is the one that forces an occupancy ratio your format cannot carry. Sometimes that location wears a high face rent. Often, in the deals that hurt most, it wears a low one.
Model the address, not the weekly headline
Once the offer sheet is in writing, test whether the shopfront’s demand profile can carry all-in occupancy — before the lease turns a soft package into a fixed cost.
Run location analysisSources and verification notes
Primary sources accessed 29 August 2026
ATO ranges are tax-reported rent-to-turnover bands for coffee shops in 2023–24, not lease quotes. Colliers figures describe retail asset-class leasing conditions in Q2 2026; they are not strip-by-strip café rents. Illustrative Lease A / Lease B numbers are teaching models. Full research notes sit in the article sources file in the repository.
Related reading
Frequently asked questions
About the author
Prashant GuleriaFounder, Locatalyze
Prashant Guleria founded Locatalyze after watching operators lose capital on leases that looked affordable on the offer sheet and impossible once realistic revenue was counted.
Tools first — then a full report for your address
Free rent, viability, and break-even checks. Upgrade when you are ready for competitors, map, and numbers for a specific site.
No signup required for tools