Australia's Fastest-Growing Suburbs Have a Retail Problem: New Residents Do Not Guarantee New Customers
Founder, Locatalyze
Melton added 12,673 residents in a single year. Kwinana grew 4.6 per cent. Serpentine-Jarrahdale grew 4.5 per cent. These are powerful numbers, and they are exactly the kind of numbers that can lead a business owner into the wrong shop. Population growth describes people arriving inside a boundary. It does not tell you whether those people pass your frontage, whether the school and supermarket are open, whether they still shop near their old suburb, or whether the centre beside your tenancy will be delivered two years late. Australia's outer growth corridors are full of genuine opportunity. They are also full of timing risk. The winning question is not simply which suburb is growing fastest. It is whether enough occupied households have formed a repeat market for this business, at this address, before the rent and working capital run out.
Evidence standard
FACT: ABS Estimated Resident Population and components where linked (release dates labelled). Growth ≠ automatic café/restaurant opportunity. Format guidance and readiness labels are LOCATALYZE ANALYSIS. Do not treat ERP growth alone as a PROCEED signal.
Visual note
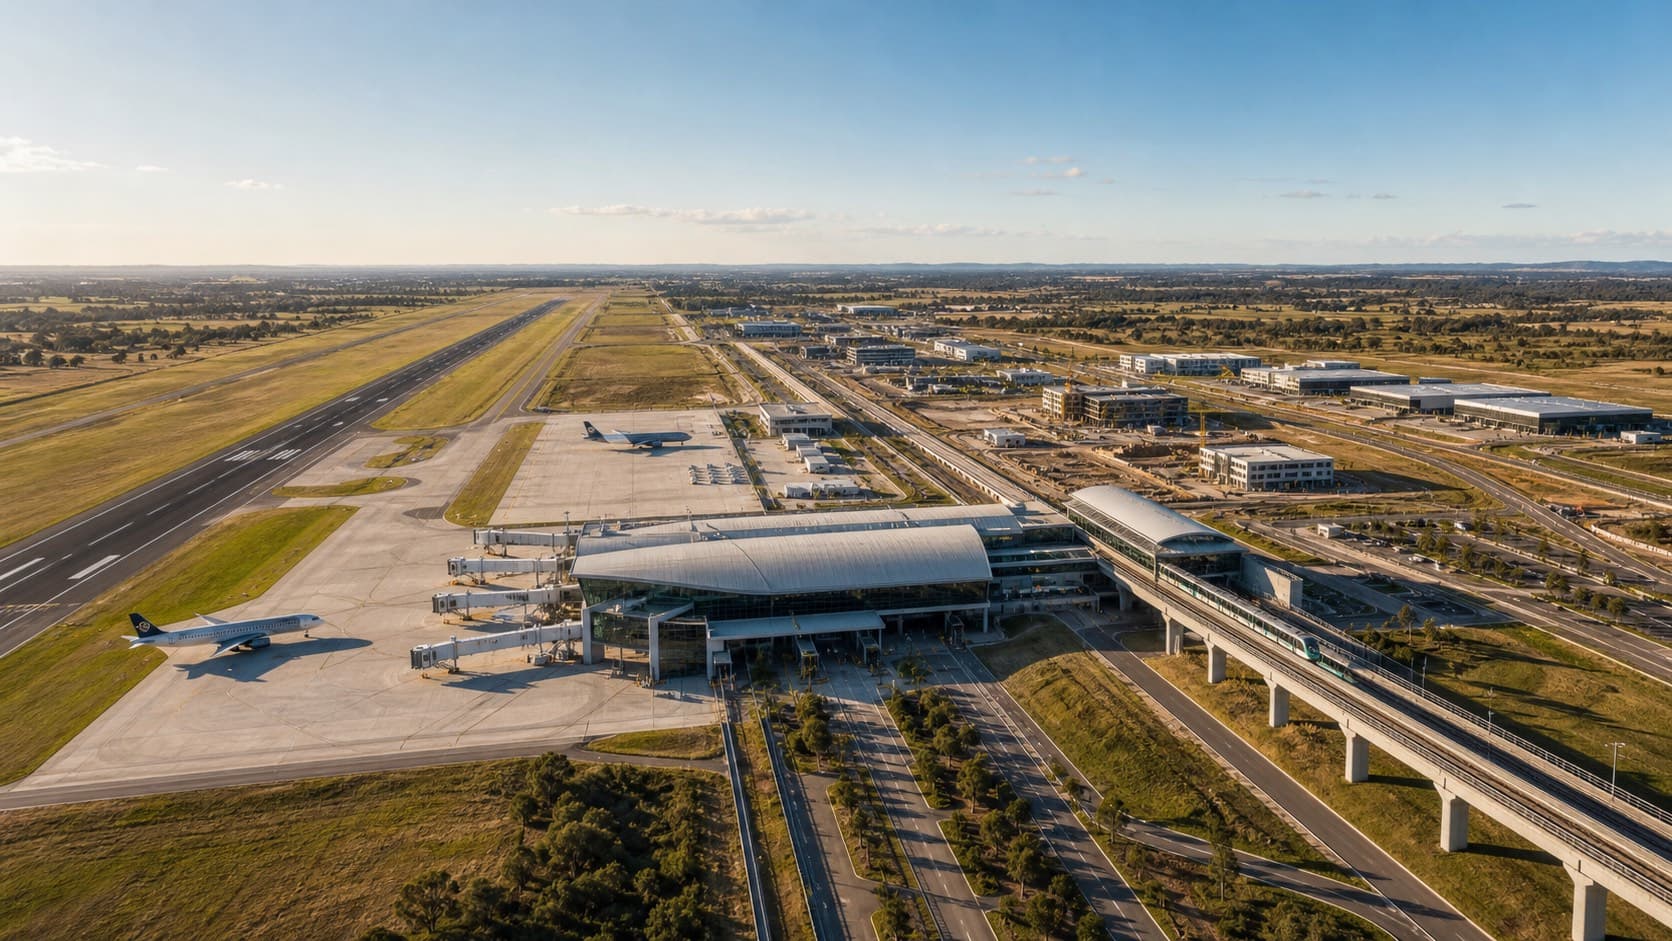
The hero is a Locatalyze editorial rendering of an Australian growth corridor. It is not a photograph of a named suburb, development or approved planning scheme.
The fastest-growing list is real. The business conclusion is not automatic.
The Australian Bureau of Statistics released its latest regional population estimates on 31 March 2026. For the year to 30 June 2025, the fastest-growing local government areas were concentrated around capital-city edges: Melton and Mitchell around Melbourne; Kwinana, Serpentine-Jarrahdale, Swan, Murray, Dandaragan and Chittering around Perth; Playford in Adelaide; and Wollondilly on Sydney's outer south-western edge. At the smaller Statistical Area Level 2 scale, the highest growth rates included Fraser Rise-Plumpton, Tarneit-North, Box Hill-Nelson, Clyde North-South, Virginia-Waterloo Corner and Ripley.
That geography is not surprising. New detached housing is easier to deliver at the edge than in established inner suburbs. Greenfield estates can add thousands of dwellings across large release areas. Young households move in, births add to the population, and internal migration shifts residents from established areas into new homes. Roads, schools, health services, public transport, jobs and local centres then have to catch up with a settlement pattern that is still being built.
A business owner sees the growth rate and imagines a rising sales line. A developer brochure supplies the future town centre, the future school and the ultimate number of dwellings. The lease, however, starts in the present. Staff need wages next Thursday. The electricity account arrives before the next subdivision stage. A seven-year term does not pause because the anchor tenant's opening slips from March to November. Growth can be true at the regional level and still be unavailable to one shop.
+12,673
Melton residents added in 2024-25, the largest increase in this comparison
5.8%
Melton's annual population growth rate
4.6%
Kwinana's annual population growth rate
24/km²
Wollondilly's population density, despite 3.9% annual growth
The contrast between Melton and Wollondilly makes the analytical problem clear. Melton reached an estimated 231,567 residents at June 2025 and had about 439 people per square kilometre across the LGA. Wollondilly reached 62,080 residents and about 24 people per square kilometre. Both appeared among the highest-growth-rate LGAs, but the same business format cannot use those totals in the same way. A geographically compact customer routine and a dispersed car-dependent catchment produce different visit frequencies, competitor sets, delivery costs and marketing economics.
Population growth tells you that demand is being created. It does not tell you where, when or by whom that demand will be captured.
Growth-corridor readiness test
Is the suburb growing, or is your customer market ready?
Change the business format and delivery stage. Then inspect the official 2024-25 population profile behind six fast-growing LGAs.
1. Business format
Frequent morning paths, nearby workers and enough reasons to return between school runs.
2. Local delivery stage
Cafe / Roofs first
High timing risk
New households do not automatically create a concentrated morning trade. Construction crews can help, but that demand can disappear when the estate is finished.
3. Inspect a growth market
These are official LGA-level figures, not suburb-level site scores. Select one to see why growth rate alone is incomplete.
VIC local government area
Melton
Components of change
What the LGA figure does not settle
The largest one-year increase in this comparison and a substantial existing population, but demand still varies sharply between established centres and new estates.
A growth-corridor headline cannot test your tenancy. Compare the occupied catchment, competitors, access and rent around the actual address.
Free location score, map, data confidence and PROCEED / VERIFY / AVOID recommendation. Modelled financials stay optional.
Analyse a growth-area locationOne number is doing too many jobs
Estimated Resident Population, or ERP, is the official estimate of people who usually live in an area. It is excellent for understanding how settlement is changing. It is not a customer count. The LGA boundary can include established town centres, industrial precincts, farmland, older suburbs and multiple new estates separated by long drives. An annual change figure can combine births, arrivals from overseas and moves from other parts of Australia. Those groups do not necessarily have the same age, income, household structure, travel pattern or service need.
In Melton, the 2024-25 increase comprised net internal migration of 7,441 people, natural increase of 3,585 and net overseas migration of 1,647. In Swan, the three components were 3,441, 1,706 and 2,047 respectively. Wollondilly's increase was dominated by net internal migration, while Kwinana had meaningful contributions from all three components. This helps describe why the population changed. It still does not identify which side of an arterial road will support a cafe.
The useful move is to step down through the geography. Start with the LGA to understand scale and direction. Move to the SA2 or suburb to identify where growth is concentrated. Move again to a practical drive-time or walk-time catchment around the tenancy. Finally, trace the customer journey: home to school, home to work, station to car park, supermarket to exit, or GP to allied-health appointment. Each step removes population that cannot realistically reach the business.
The five clocks inside every new growth corridor
Growth areas do not mature according to one opening date. At least five clocks are running, and a business can fail when it assumes they are synchronised.
The delivery sequence
- 1
Planning clock. Land is identified, rezoned or placed inside a structure plan. This creates development capacity, not customers.
- 2
Housing clock. Civil works, titles, dwelling construction, settlement and physical occupancy happen in sequence. A sold lot is not yet a weekly grocery trip.
- 3
Infrastructure clock. Roads, schools, parks, public transport, health facilities and utilities are funded, designed and delivered on their own programs.
- 4
Commercial clock. Supermarkets, town centres, fuel, childcare, medical and hospitality open when developers and tenants believe the catchment is viable.
- 5
Habit clock. Residents decide where they shop, exercise, eat and seek care. Those routines may continue in an old suburb until a local offer becomes easier or better.
The habit clock receives the least attention and may matter most. A family can move into a new estate while keeping the same GP, childcare centre, gym, weekend cafe and major shopping trip. Their address changes immediately; their spending geography changes gradually. If both adults commute out of the area, weekday purchases may follow employment rather than home. If the estate has one congested exit, residents may combine errands near a motorway interchange instead of stopping at a neighbourhood strip.
Infrastructure Australia has repeatedly identified weaker public-transport access and longer travel times in outer suburbs. Its 2026 Infrastructure Priority List says investment in high-capacity transport is needed for growing populations and that road upgrades supporting middle and outer suburbs, new housing, bus priority and employment precincts remain important. That is not evidence that every growth area is inaccessible. It is evidence that accessibility cannot be assumed from a housing forecast.
Current state planning material tells the same story in local form. Victoria uses Growth Areas Infrastructure Contributions across Cardinia, Casey, Hume, Melton, Mitchell, Whittlesea and Wyndham to help fund infrastructure in expanding communities. The Greater Adelaide Regional Plan assesses growth areas partly through physical and social infrastructure capacity and the cost of provision. NSW's 2026 Greater Sydney Infrastructure Opportunities Plan describes roads, schools, hospitals, water and wastewater work supporting growth in Macarthur and Wollondilly. Serpentine-Jarrahdale's own plans and budgets explicitly connect rapid growth with pressure on roads, community facilities and services.
Read the wording carefully
Planned is not funded. Funded is not contracted. Contracted is not under construction. Under construction is not open. Open is not necessarily on the customer path. Record each project at its actual stage.
Six markets, six different business readings
The table is deliberately an LGA comparison, not a recommendation. Density is averaged across the full council area and can conceal concentrated urban neighbourhoods. ERP is rounded only where the prose uses rounded language; the table retains the ABS values. The point is to see how different the starting positions are before descending into local catchments.
Melton: enormous growth, but not one market
Melton's increase of 12,673 residents is commercially significant. It is larger than the entire population of many Australian towns. The LGA includes established Melton, fast-delivering communities in Melbourne's west and neighbourhoods with very different access to rail, schools, shopping and employment. That scale supports more services, but it also attracts national retailers, health groups, childcare operators and fitness chains that can secure sites before an independent operator sees the leasing campaign.
For a cafe, the difference between a station path, a school-side tenancy and an early neighbourhood centre can be the whole business. For allied health, the more important map may show young-family households, GPs, parking and appointment travel. For convenience, an arterial road is useful only if drivers can enter and exit in their actual direction of travel. Melton's growth justifies investigation. It does not excuse block-level work.
Kwinana: growth inside a more concentrated urban fabric
Kwinana recorded the highest average density in this comparison, about 478 people per square kilometre, and added 2,516 residents. It combines established residential areas, industrial employment and newer housing. That mixture can support more than a simple family-retail thesis. Worker food, vehicle services, training, health and practical B2B formats may draw from employment as well as households.
The trap is to combine those demand sources without proving either. Industrial workers may be behind secure gates, supplied by site catering or travelling on a route that misses the tenancy. New households may orient toward an established regional centre. Analyse residential and employment catchments separately, then count only the overlap that can physically and conveniently reach the door.
Serpentine-Jarrahdale: high percentage growth from a smaller base
Serpentine-Jarrahdale reached an estimated 40,531 residents after adding 1,738 in 2024-25. Its 4.5 per cent growth rate is striking, while its average density remains about 45 people per square kilometre. Byford carries much of the urban growth story, but the LGA extends well beyond one centre. The Shire describes itself as a hyper-growth council and its recent plans identify the need for continuing investment in roads, recreation and community facilities.
This is where percentage growth needs context. Four and a half per cent of a smaller base can produce less immediate customer volume than a lower rate applied to a larger urban market. A childcare operator may still see a strong case if the age structure and approved-place pipeline align. A premium restaurant requiring dense evening trade may need more patience. The correct conclusion depends on format, not applause for the rate.
Swan: a large LGA that punishes broad averages
Swan added 7,194 residents and reached 187,090. It includes established Midland, industrial and logistics land, the Swan Valley and fast-growing north-eastern communities. The population figure is large enough to create false confidence because so many distinct travel patterns sit inside it. A site in Brabham is not competing in the same immediate market as a site in Midland, even though both appear in the same LGA total.
The ABS notes Brabham-Henley Brook among Western Australia's highest-growth-rate SA2s in 2024-25. That smaller geography is a better starting point for a local retail question, but it still needs dwelling occupancy, anchor timing, access and competitor checks. For Swan, the analytical discipline is subtraction: remove residents beyond the practical catchment, remove trips captured by established centres, and remove future dwellings that are not occupied.
Playford: northern growth with centre choices already in play
Playford added 4,357 residents and reached 115,790. Internal migration contributed most of the annual increase. Adelaide's northern growth is supported by established centres and continuing greenfield planning, including work around areas such as Riverlea and Playford Alive. The Greater Adelaide Regional Plan does not treat greenfield land as interchangeable; its technical work considers infrastructure capacity, land suitability, costs and climate resilience.
For an operator, the practical issue is which hierarchy of centres wins each trip. A neighbourhood offer may capture convenience and family services while comparison shopping and entertainment remain at a larger centre. A proposed site beside new homes can look empty of competition because the real competitor is fifteen minutes away on the route residents already drive. That competitor belongs in the model.
Wollondilly: rapid growth spread across long distances
Wollondilly added 2,321 residents at 3.9 per cent growth, yet its LGA-wide density was only about 24 people per square kilometre. The NSW Government is planning substantial housing and infrastructure across Greater Macarthur and Wilton, with work spanning roads, schools, water, wastewater and future transport. This is a major long-horizon growth story and an immediate warning against radius-based analysis.
A ten-kilometre circle in a dense suburb and a ten-kilometre circle in Wollondilly do not create equivalent customer access. Road geometry, town boundaries, congestion and destination habits matter. A destination business may draw widely. A weekday lunch offer usually cannot. The business model should use realistic travel times and purposes, then attach planned housing only when its delivery stage is known.
Which formats can move early, and which need mature routines?
Early does not mean careless. Childcare can precede mature retail because young families create a specific need, but the sector is highly sensitive to approved supply and staffing. Allied health can open with a modest room footprint before a town centre is complete, but only when referral and appointment demand is real. Convenience can trade from an early route, yet one difficult right turn can erase the theoretical catchment.
Cafes and restaurants are often less forgiving than growth brochures suggest. Residents do not buy breakfast in proportion to population. They buy it where a morning routine makes the stop easy. A cafe beside a busy school can be strong for forty minutes and quiet for the next four hours. Construction workers may create an excellent weekday trade before moving to the next estate. Neither pattern is inherently bad; both need a cost base and lease term designed around the demand that will remain.
The lease can turn future growth into present pain
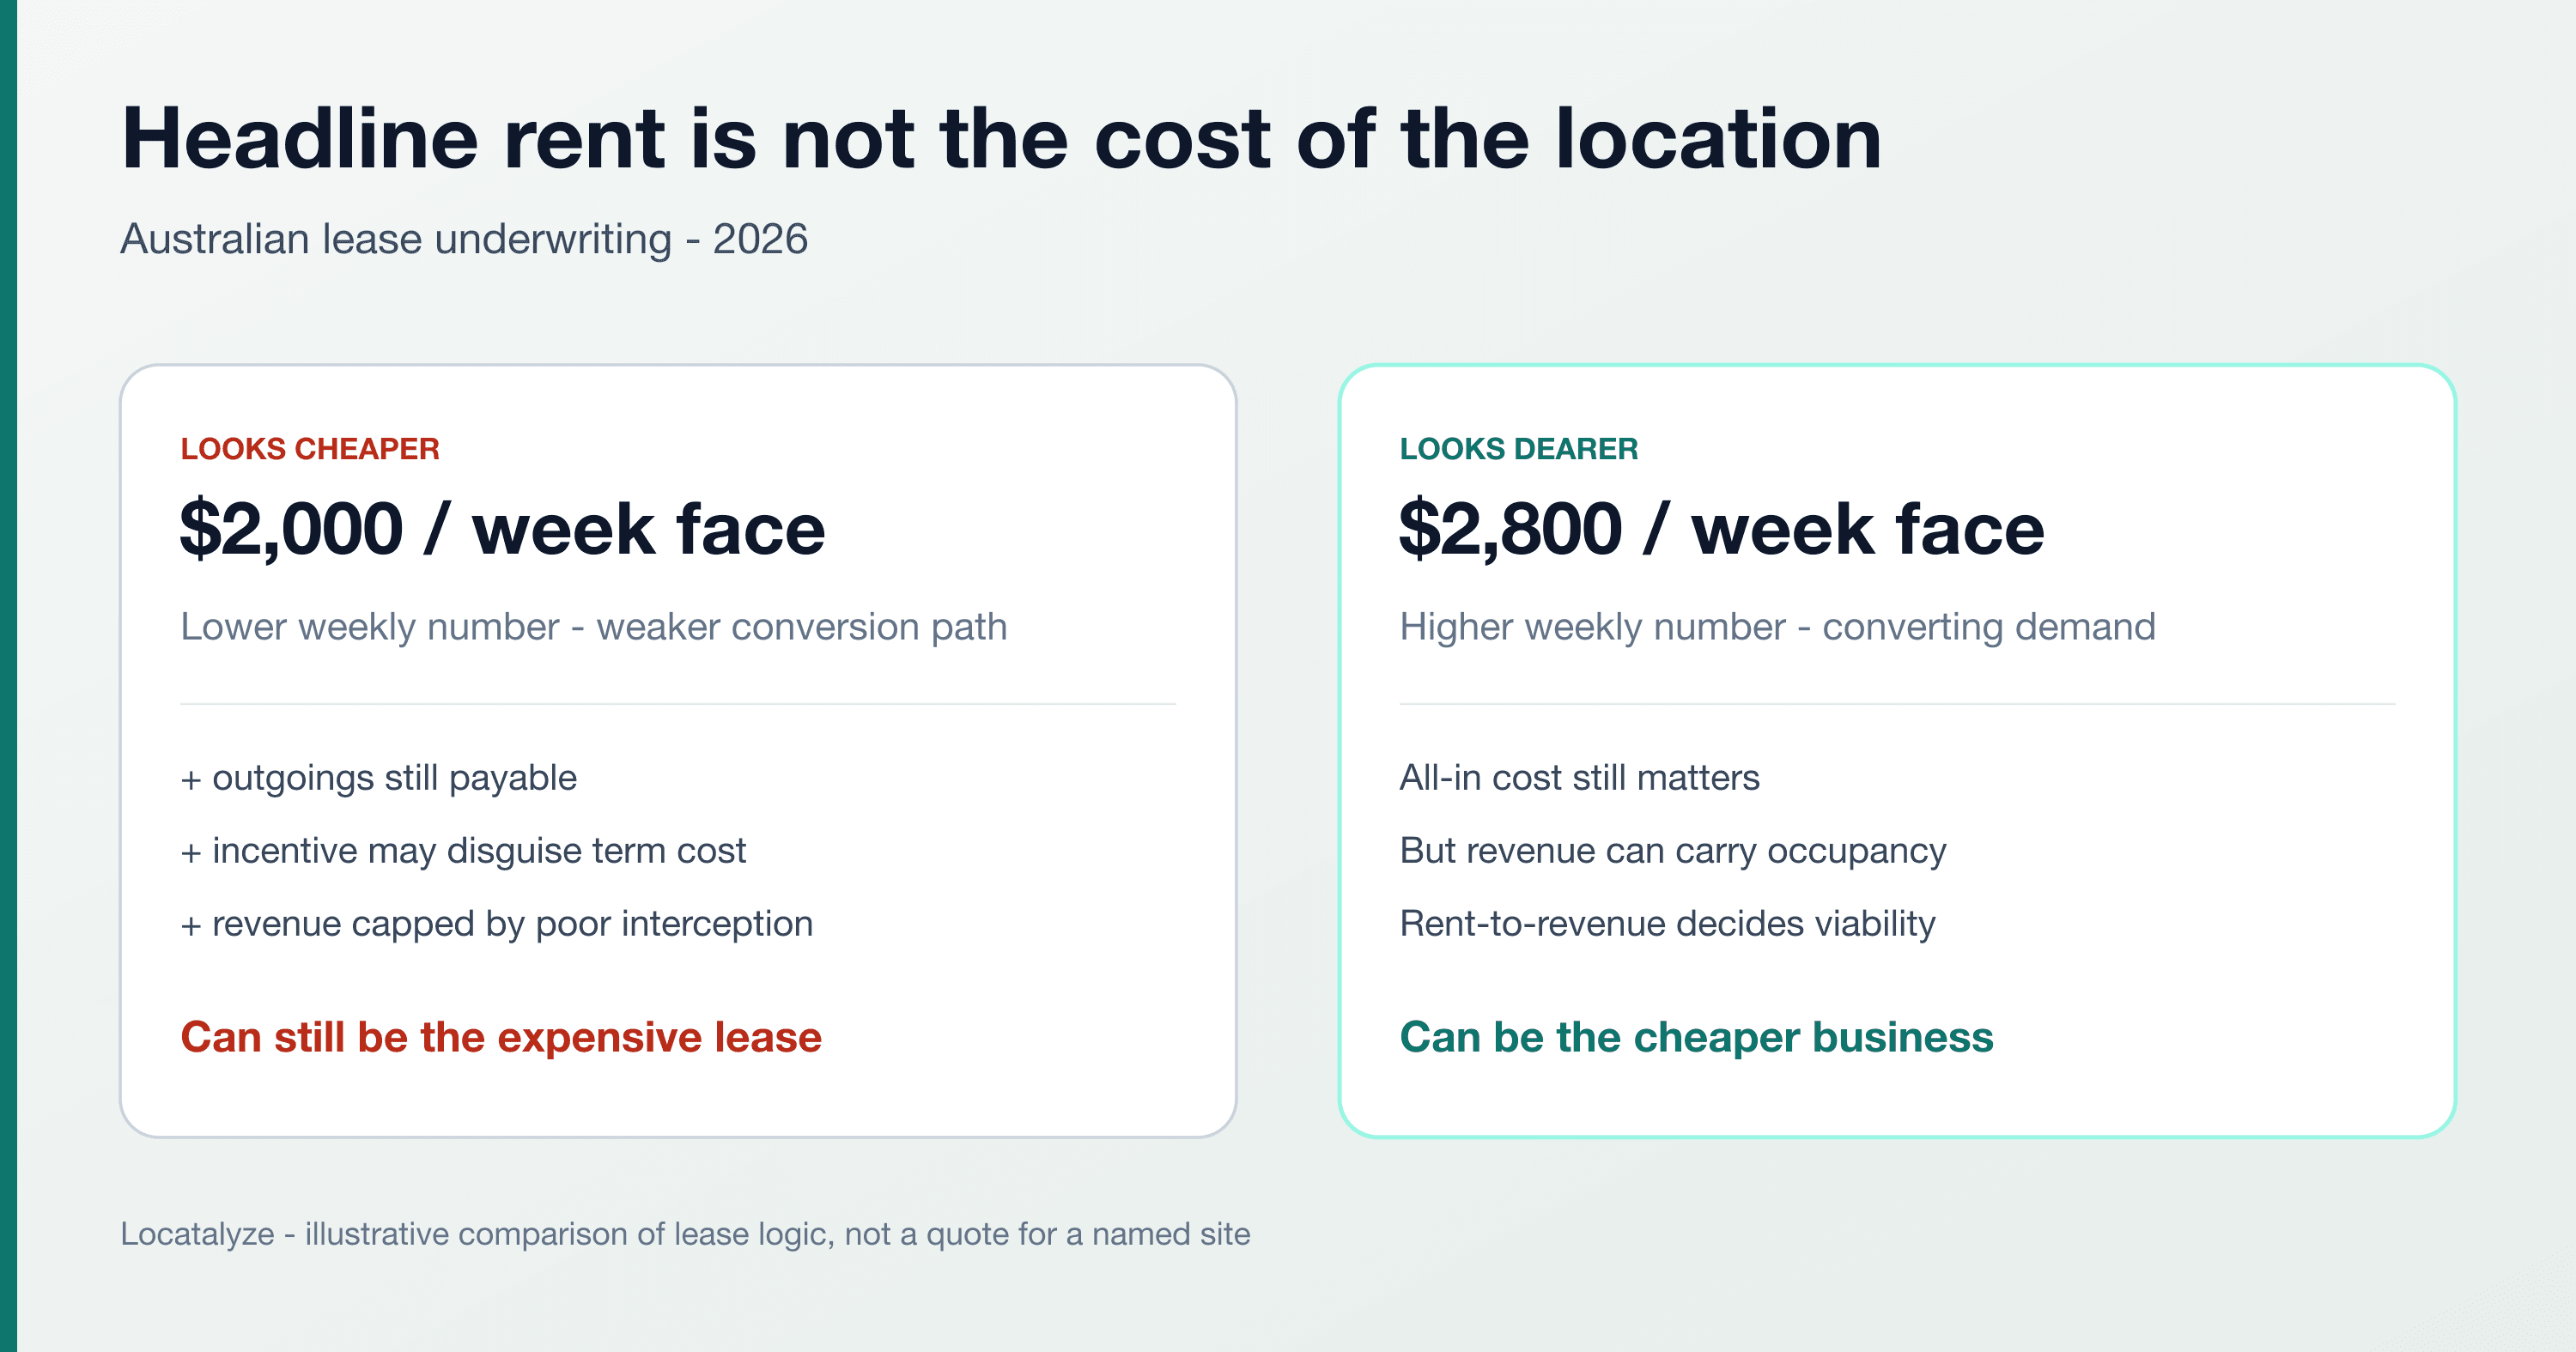
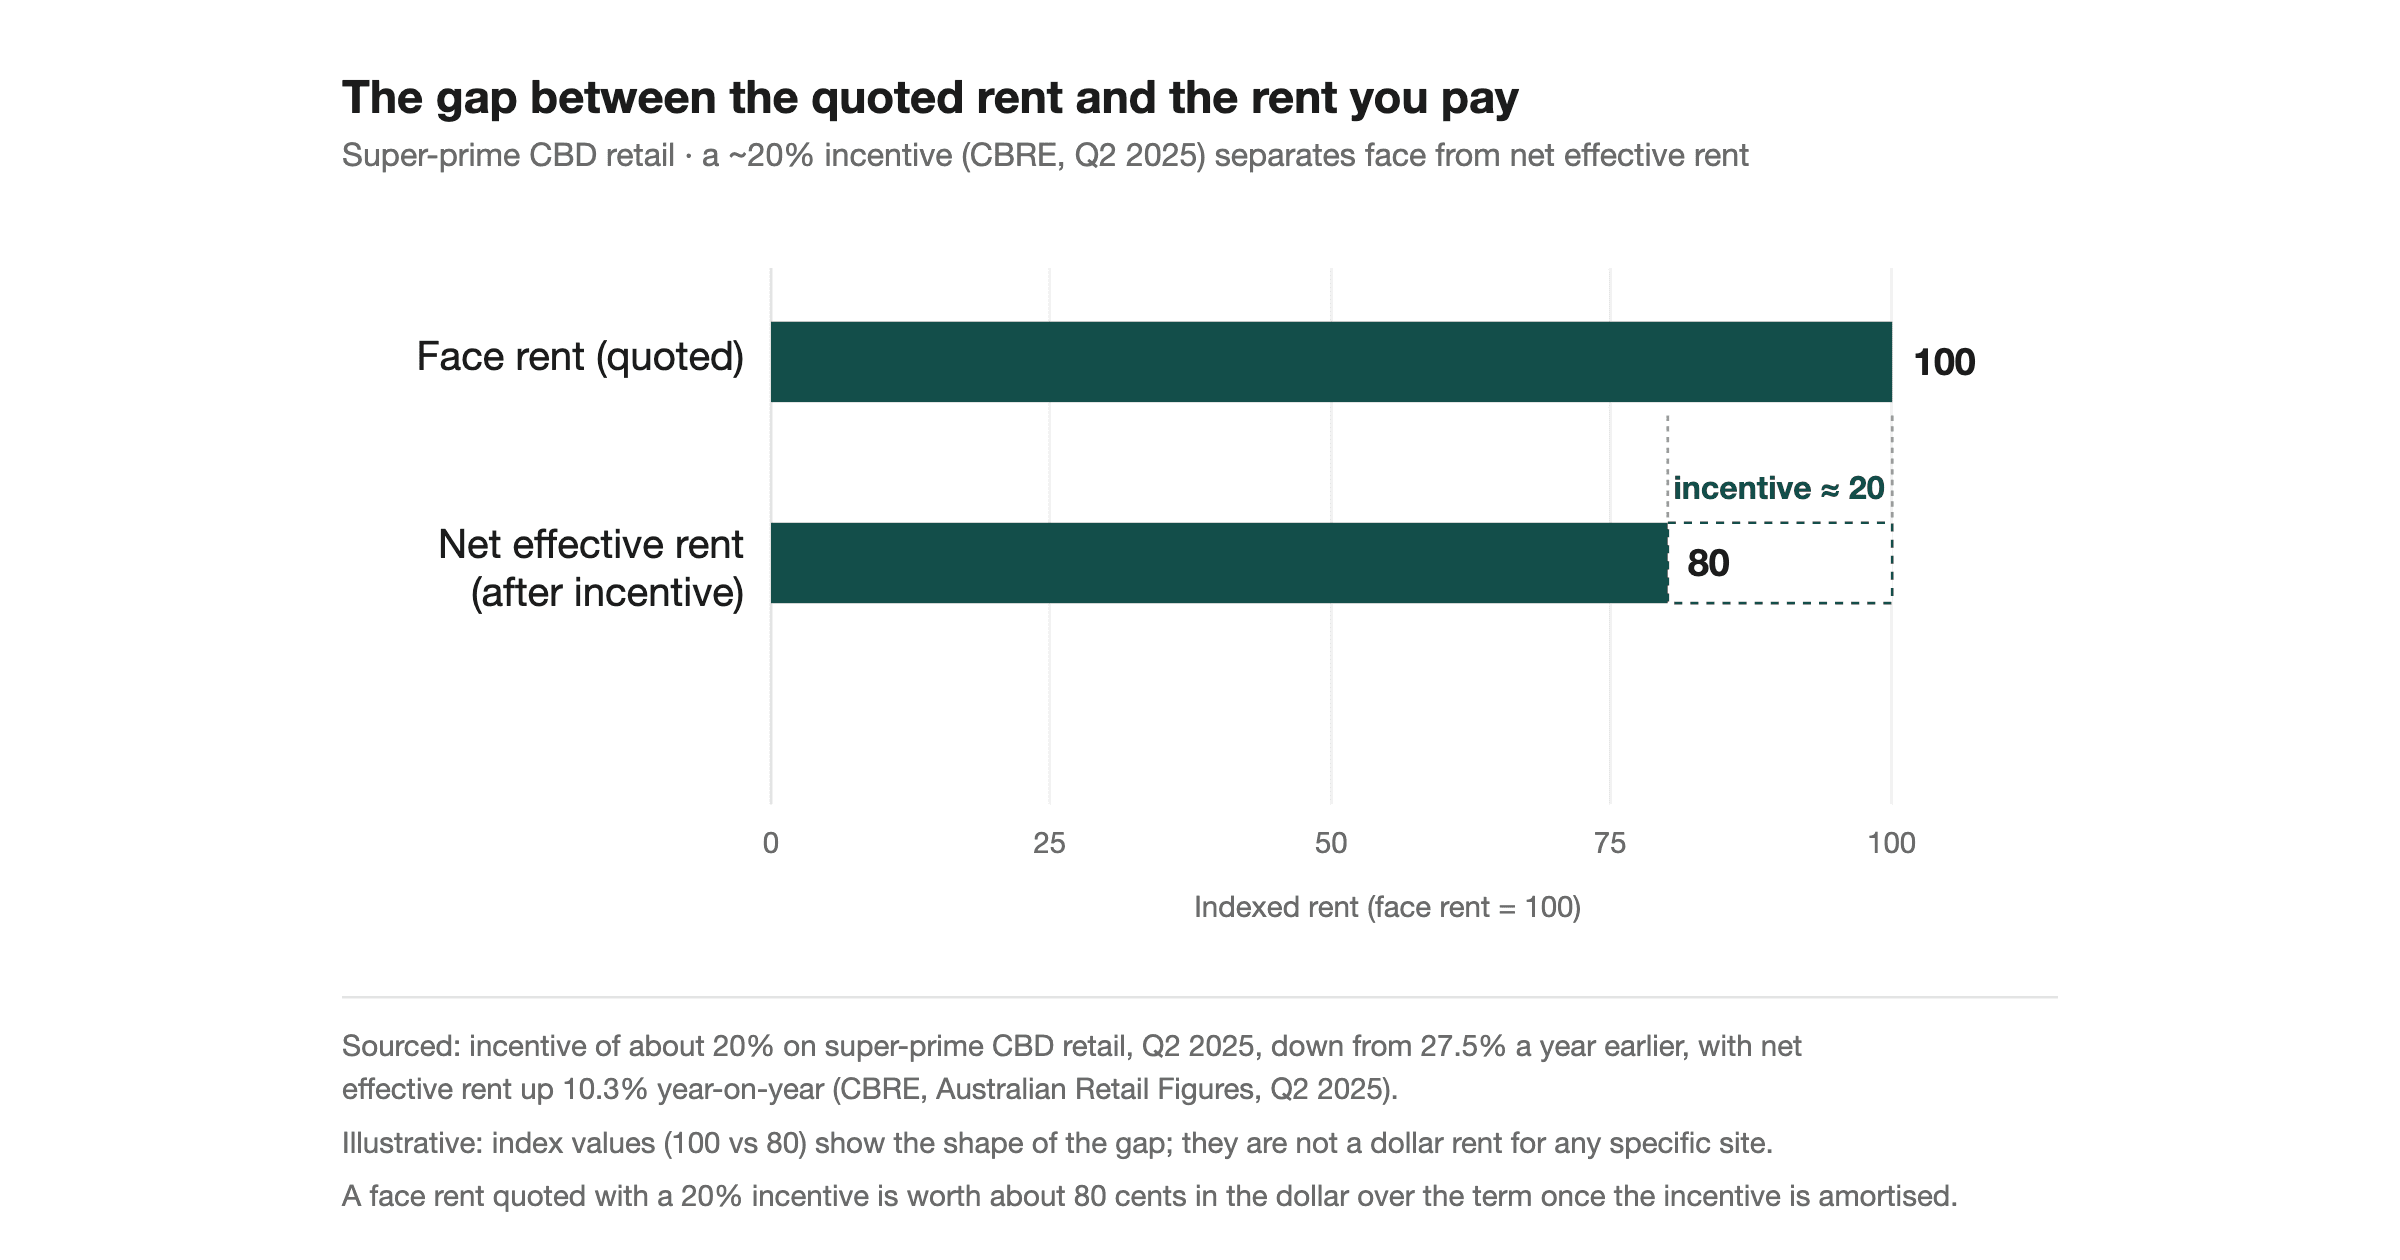
Growth-area landlords naturally sell the future. Their investment is built around future occupancy and centre maturity. The tenant has a different cash-flow clock. Paying a premium because 8,000 dwellings are planned transfers the timing risk to the business, even when only 1,400 are occupied. The operator funds the gap through working capital.
The answer is not always to reject the location. It is to make the commitment reflect observable delivery. A smaller first stage, delayed rent commencement, stepped rent, an expansion option, landlord fit-out works or a break right tied to a defined anchor can preserve the opportunity without pretending the final market exists. These are commercial principles, not legal drafting advice; a leasing lawyer should document any condition precisely.
Avoid vague triggers such as 'town centre substantially complete'. Name the building, access road, school, station or minimum occupied tenancy area. Define the evidence and date. Consider what happens if the anchor opens but uses a different entrance, if roadworks block access for six months, or if the centre launches without the promised tenancy mix. A condition is useful only when it addresses the failure mode that matters.
The rent test
Build the base case using occupied households, open anchors and measured customer paths. Put approved construction in the expected case. Keep rezoned land and ultimate dwelling yields in the upside case. If the lease only works in the upside case, the tenant is underwriting the developer's timeline.
A field test for the next Saturday morning
Growth-corridor research improves quickly once it leaves the desktop. Visit the proposed site at the times when the business expects to make money, not only when the agent can meet. Drive from the first occupied estates. Follow the school route. Attempt each entry and exit legally. Visit the centre residents use now. Search the state planning portal for approved competitors and the local council agenda for delivery changes.
Ten checks before heads of agreement
- 1
Separate occupied dwellings from titled lots, homes under construction, approved yield and ultimate planned yield.
- 2
Draw five, ten and fifteen-minute drive-time catchments using the actual road network and peak conditions.
- 3
Count the relevant dayparts on two ordinary weekdays and one weekend. Exclude launch events and construction anomalies.
- 4
Trace school, supermarket, station and employment paths. Note which side of the road captures the return journey.
- 5
List operating competitors, approved competitors and likely anchor-tenancy substitutes separately.
- 6
Ask the anchor for a confirmed opening status and access plan. Do not rely on a leasing brochure date.
- 7
Estimate how many residents retain services in their previous suburb or near work, then stress-test that assumption.
- 8
Model twelve months with the next housing stage delayed and no sales benefit from unfunded infrastructure.
- 9
Match staffing and opening hours to observed demand instead of copying a mature-suburb roster.
- 10
Negotiate rent, space and options so the business survives if the habit clock runs slower than the housing clock.
Ask residents simple behavioural questions rather than whether they would support a new business. Where did you buy coffee last Saturday? Which supermarket did you visit? Where is your GP? What trip would make this service convenient? Reported enthusiasm is generous; recalled behaviour is more useful. Fifty short conversations can reveal whether the catchment is locally anchored or still exporting its spending.
Then count what the site can capture. A road may carry thousands of vehicles while the frontage receives almost none. A supermarket may draw the whole district while its internal cafe takes the breakfast purchase. A school may create foot traffic that cannot safely cross the road. Location analysis is the work of converting regional demand into accessible demand, and accessible demand into plausible transactions.
What can be stated confidently, and what still needs local proof
The ABS figures support a confident conclusion that population growth in 2024-25 was heavily concentrated in outer metropolitan areas and that the seven LGAs compared here grew quickly. Official planning sources support a second conclusion: governments and councils are actively planning and funding infrastructure to serve that growth, often through multi-year programs. Infrastructure Australia's national work supports a third: transport and service accessibility in outer suburbs remains an important policy and investment challenge.
None of those sources identifies the best tenancy. They do not forecast a cafe's transactions, a clinic's appointments or a gym's members. The readiness labels in the explorer are Locatalyze's decision framework, not ABS ratings. They are designed to stop an official population figure from being stretched into a sales forecast it was never intended to provide.
There is also no single category called 'growth suburb'. An established centre inside a fast-growing LGA may have dense demand and mature competition. A greenfield edge may have rapid dwelling delivery and few daily services. A regional town beside a release area may capture spending before the new centre opens. The address, format and opening date remain inseparable.
The Locatalyze verdict
PROCEED with conditions
Australia's fast-growing outer suburbs deserve serious attention from childcare, allied health, convenience, fitness, hospitality and everyday-service operators. Melton's scale, Kwinana's more concentrated urban fabric, Swan and Playford's large resident bases, and the long-term growth programs in Serpentine-Jarrahdale and Wollondilly can all create viable opportunities. Proceed only when occupied households or committed anchors can support the first-year case, the customer route has been physically verified, approved competitors are counted, and the lease can survive a delayed housing or infrastructure stage. The case fails when an LGA growth rate is treated as local foot traffic, ultimate dwelling yield is treated as present demand, or mature-centre rent is paid before residents have formed local spending routines.
The growth is regional. The risk is at the address.
Locatalyze compares catchment, competition, access, rent pressure and evidence quality around the actual site before you sign.
Run a free location scoreSources and method
Population figures are ABS Estimated Resident Population for the year ended 30 June 2025, released 31 March 2026. Components of change may not sum perfectly in every published geography because of estimation and rounding; the explorer uses the published LGA values. Planning and infrastructure statements were checked against official sources current at 28 July 2026. Business-format guidance, delivery clocks, readiness labels and lease conditions are Locatalyze interpretation, not government forecasts, property valuations, legal advice or financial advice.
Primary and authoritative sources
Related reading
Frequently asked questions
About the author
Prashant GuleriaFounder, Locatalyze
Prashant Guleria founded Locatalyze after learning first-hand how quickly a promising business can lose money when the site logic is wrong. He writes for operators who want the evidence before the lease.
Tools first — then a full report for your address
Free rent, viability, and break-even checks. Upgrade when you are ready for competitors, map, and numbers for a specific site.
No signup required for tools