Australia’s CBDs Are Recovering. That Does Not Mean Your Format Should Open There Yet.
Founder, Locatalyze
“The CBD is back” is doing a lot of work in leasing conversations right now. Parts of that story are true. Sydney’s retail core is tight. Brisbane’s office market is absorbing space. Colliers says Sydney CBD foot traffic is within striking distance of pre-pandemic levels, and dining is leading CBD retail rent growth. None of that tells you whether a lunch café on a side lane, a dinner restaurant on a quiet edge block, or a specialty retailer in a newly opened Melbourne centre should sign this quarter. CBD recovery is three clocks — office, retail vacancy and your daypart — and they do not move together.
Evidence standard
Retail vacancy figures are from CBRE’s Australian CBD Retail Vacancy survey for H1 2026. National 10.8% (+40 bp) aligns with CBRE’s insights landing (13 Aug 2026) and with Inside Retail (24 Aug 2026) / retailbiz trade reporting — both trade pages were opened and cross-checked on 29 Aug 2026; the downloadable CBRE PDF was not opened ungated. City comparisons that need a split follow the opened Inside Retail write-up. Office figures are from JLL’s Q2 2026 office release (opened on jll.com.au, 9 July 2026). Foot-traffic and CBD retail rent direction come from Colliers’ Australian Retail Snapshot Q2 2026. City comparisons that mix office and retail series are Locatalyze analysis — vintages differ by roughly a quarter. No invented footfall counts or named fictional venues.
The national headline hides the decision
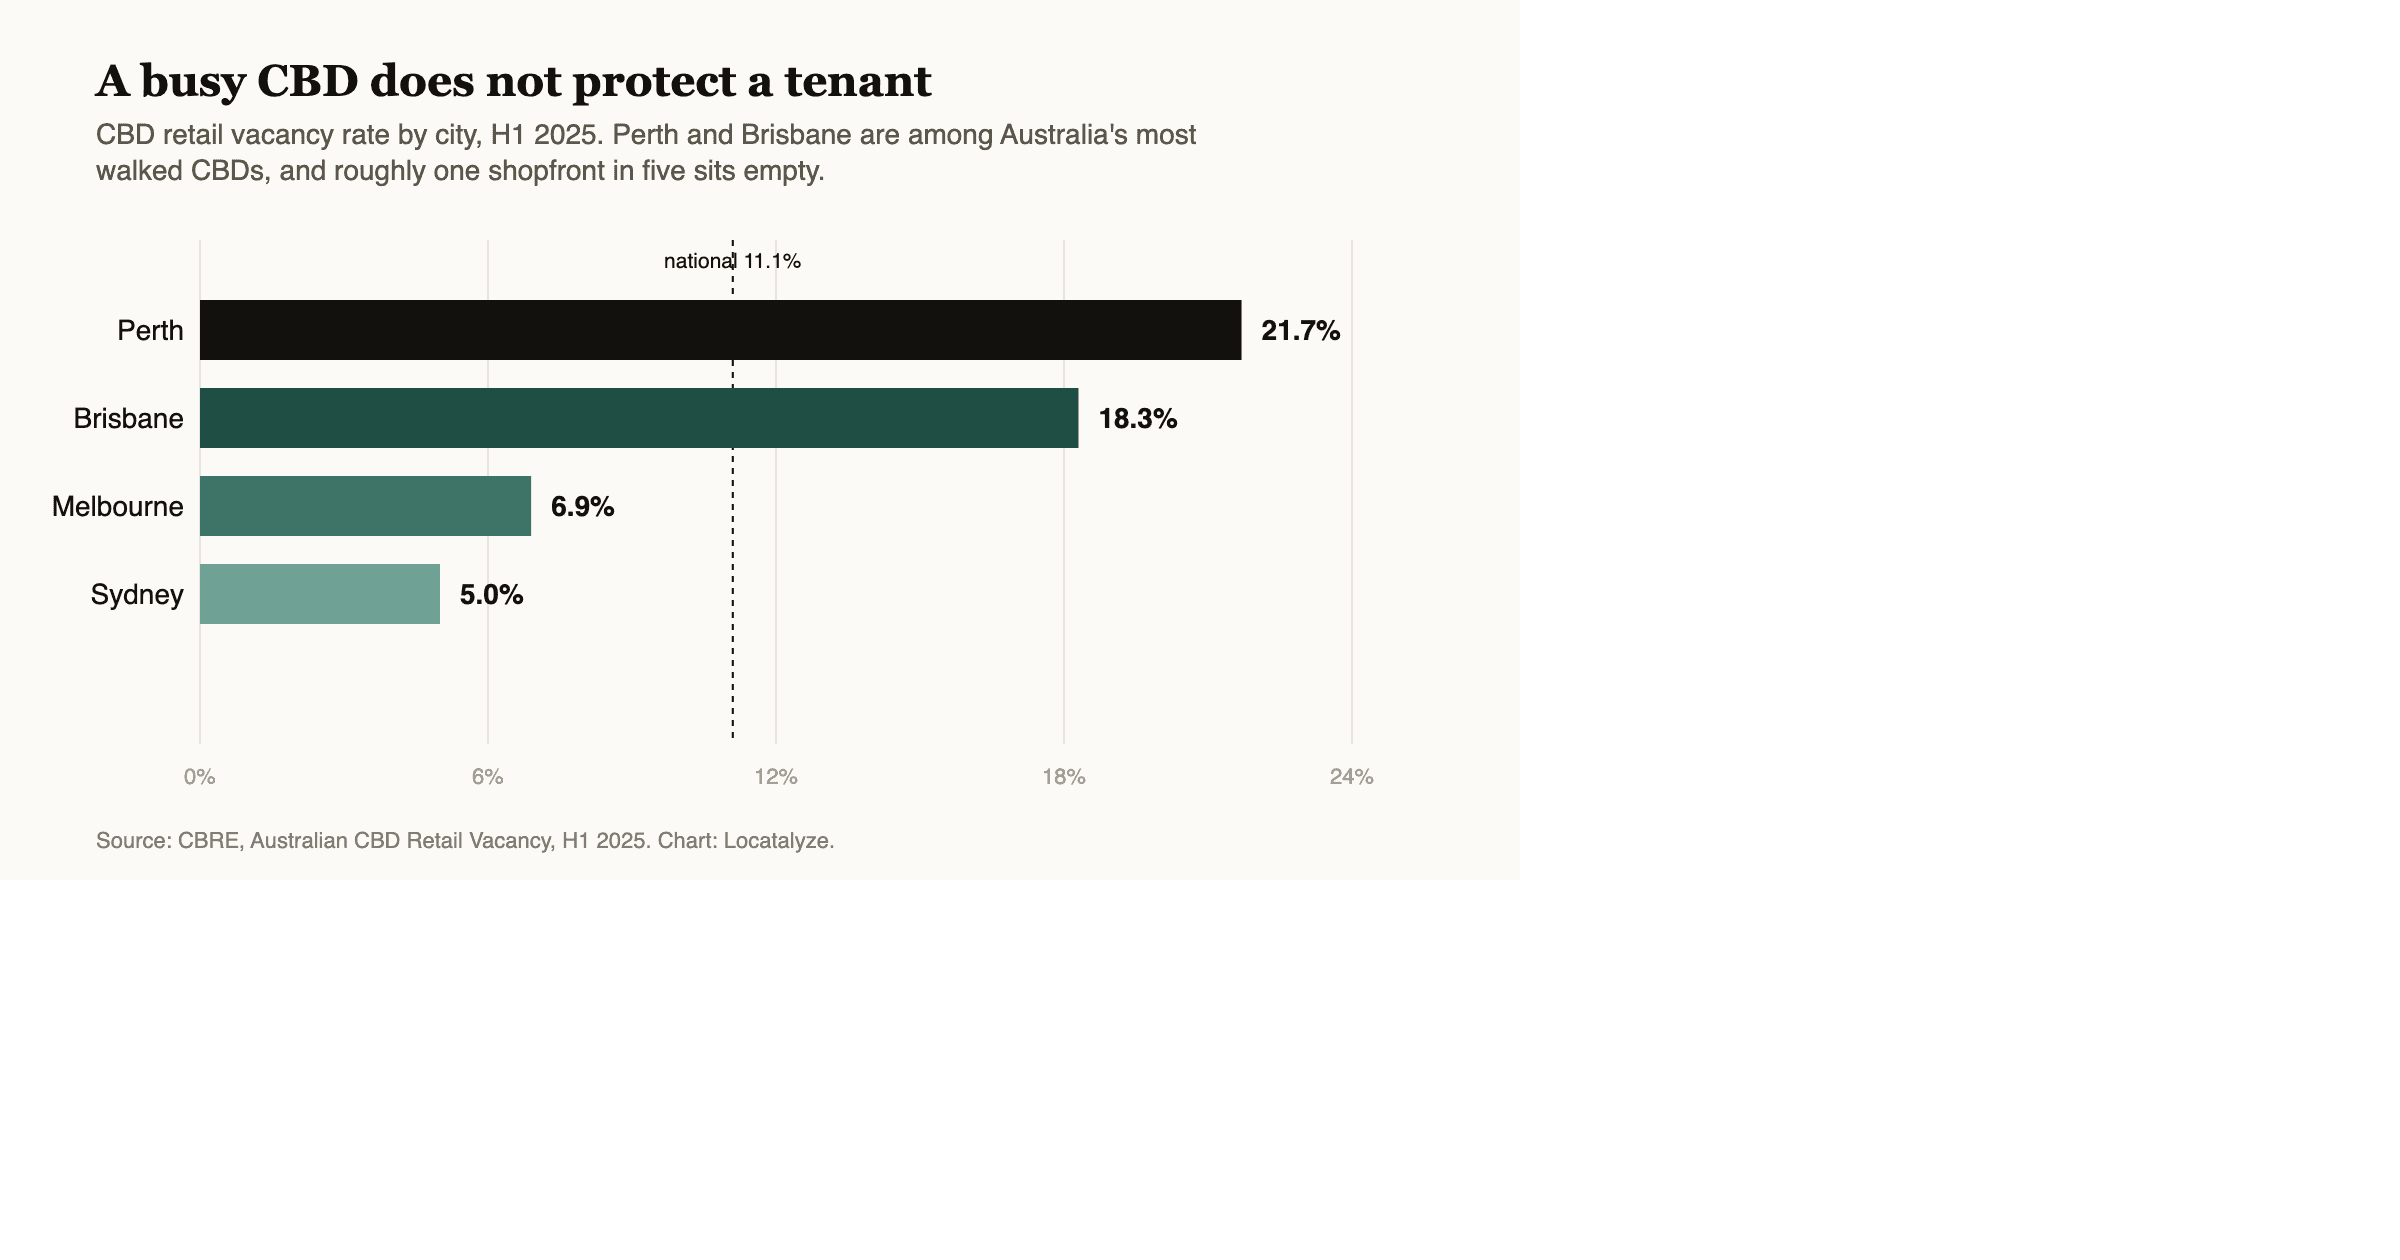
CBRE’s H1 2026 CBD retail survey put the national vacancy rate at 10.8%, up 40 basis points. Read only that line and you might conclude city-centre retail is softening. Read the next lines and the story flips. The survey covered 5,669 outlets across five capital CBDs. Vacancy fell in four of the five cities. The national increase was driven largely by Melbourne, where vacancy rose 160 basis points to 8.1% after two new retail centres added vacant floorspace to the sample. That is a supply event, not a national demand collapse.
Sydney sits at 5.3% — the tightest core in the set. Adelaide improved the most, down 130 basis points to 10.4%. Brisbane eased 80 basis points but remains elevated at 16.7%. Perth eased 10 basis points to 18.5%. Same country. Five different leasing problems.
10.8%
National CBD retail vacancy, CBRE H1 2026 (+40 bp)
5.3%
Sydney CBD retail vacancy — tightest of the five capitals
15.3%
National CBD office vacancy unchanged over FY25/26 (JLL)
A rising national vacancy rate can mean new centres opened — not that every CBD shopfront is failing.
Office recovery is real. It is also the wrong single proxy.
JLL’s Q2 2026 office release is clearer than the slogans. Five of six monitored CBD office markets recorded positive net absorption in the quarter. National vacancy held at 15.3% over the 2025/26 financial year. Sydney CBD vacancy compressed to 13.9%, its lowest since early 2023. Brisbane was the standout: vacancy 10.6%, prime grade 7.7%, and prime gross effective rents up 8.3% over the financial year. Melbourne office vacancy moved the other way, to 20.5%, with negative absorption.
For a hospitality operator, office recovery matters only for the hours and paths that feed your format. A weekday lunch café cares about occupied towers, building entrances and the desire line between them. A destination dinner room cares whether people still have a reason to stay after 6pm. A weekend specialty retailer may care more about events, tourism and residential catchments than about Tuesday desk attendance. Treating “return to office” as a universal green light is Locatalyze’s definition of a category error.
Locatalyze analysis
Compare Brisbane and Melbourne on the two series above and the slogan breaks. Brisbane’s office market is among the tightest; its CBD retail vacancy remains far above Sydney’s. Melbourne’s office market is the softest major CBD in JLL’s set, yet its CBRE retail vacancy is still in single digits after a supply-driven lift. Office tightness is not a retail sales forecast.
What Colliers adds on foot traffic and format
Colliers’ Australian Retail Snapshot for Q2 2026 says Australian CBD retail precincts continued to strengthen, with Sydney foot traffic within 9% of pre-pandemic levels as office workers, tourists and city visitors returned. CBD retail gross face rents rose about 0.4% annuallyually nationwide, with growth led by dining and hospitality. CBD retail also improved modestly in Colliers’ broader retail commentary, supported by hospitality and experiential demand, while incentives compressed across most retail classes.
That is useful direction. It is not a street-level count for your doorway. “Within 9% of pre-pandemic” for Sydney is a city-centre recovery signal, not proof that a laneway tenancy converts, and not transferable to Perth or Brisbane without local counting. CBRE’s own tenant-rep commentary emphasises experience-led formats — food and beverage, entertainment, wellness — as active CBD demand. The operators who win that shift are the ones who match format to the recovered daypart, not the ones who rent any vacant CBD shell because the national chart bent the right way.
City averages cannot score your frontage, competitors or daypart mix. Test the exact CBD address before the lease hardens.
Free location score, map, data confidence and PROCEED / VERIFY / AVOID recommendation. Modelled financials stay optional.
Analyse a CBD locationCity by city: what the 2026 numbers imply for operators
Sydney — scarce core, expensive mistakes
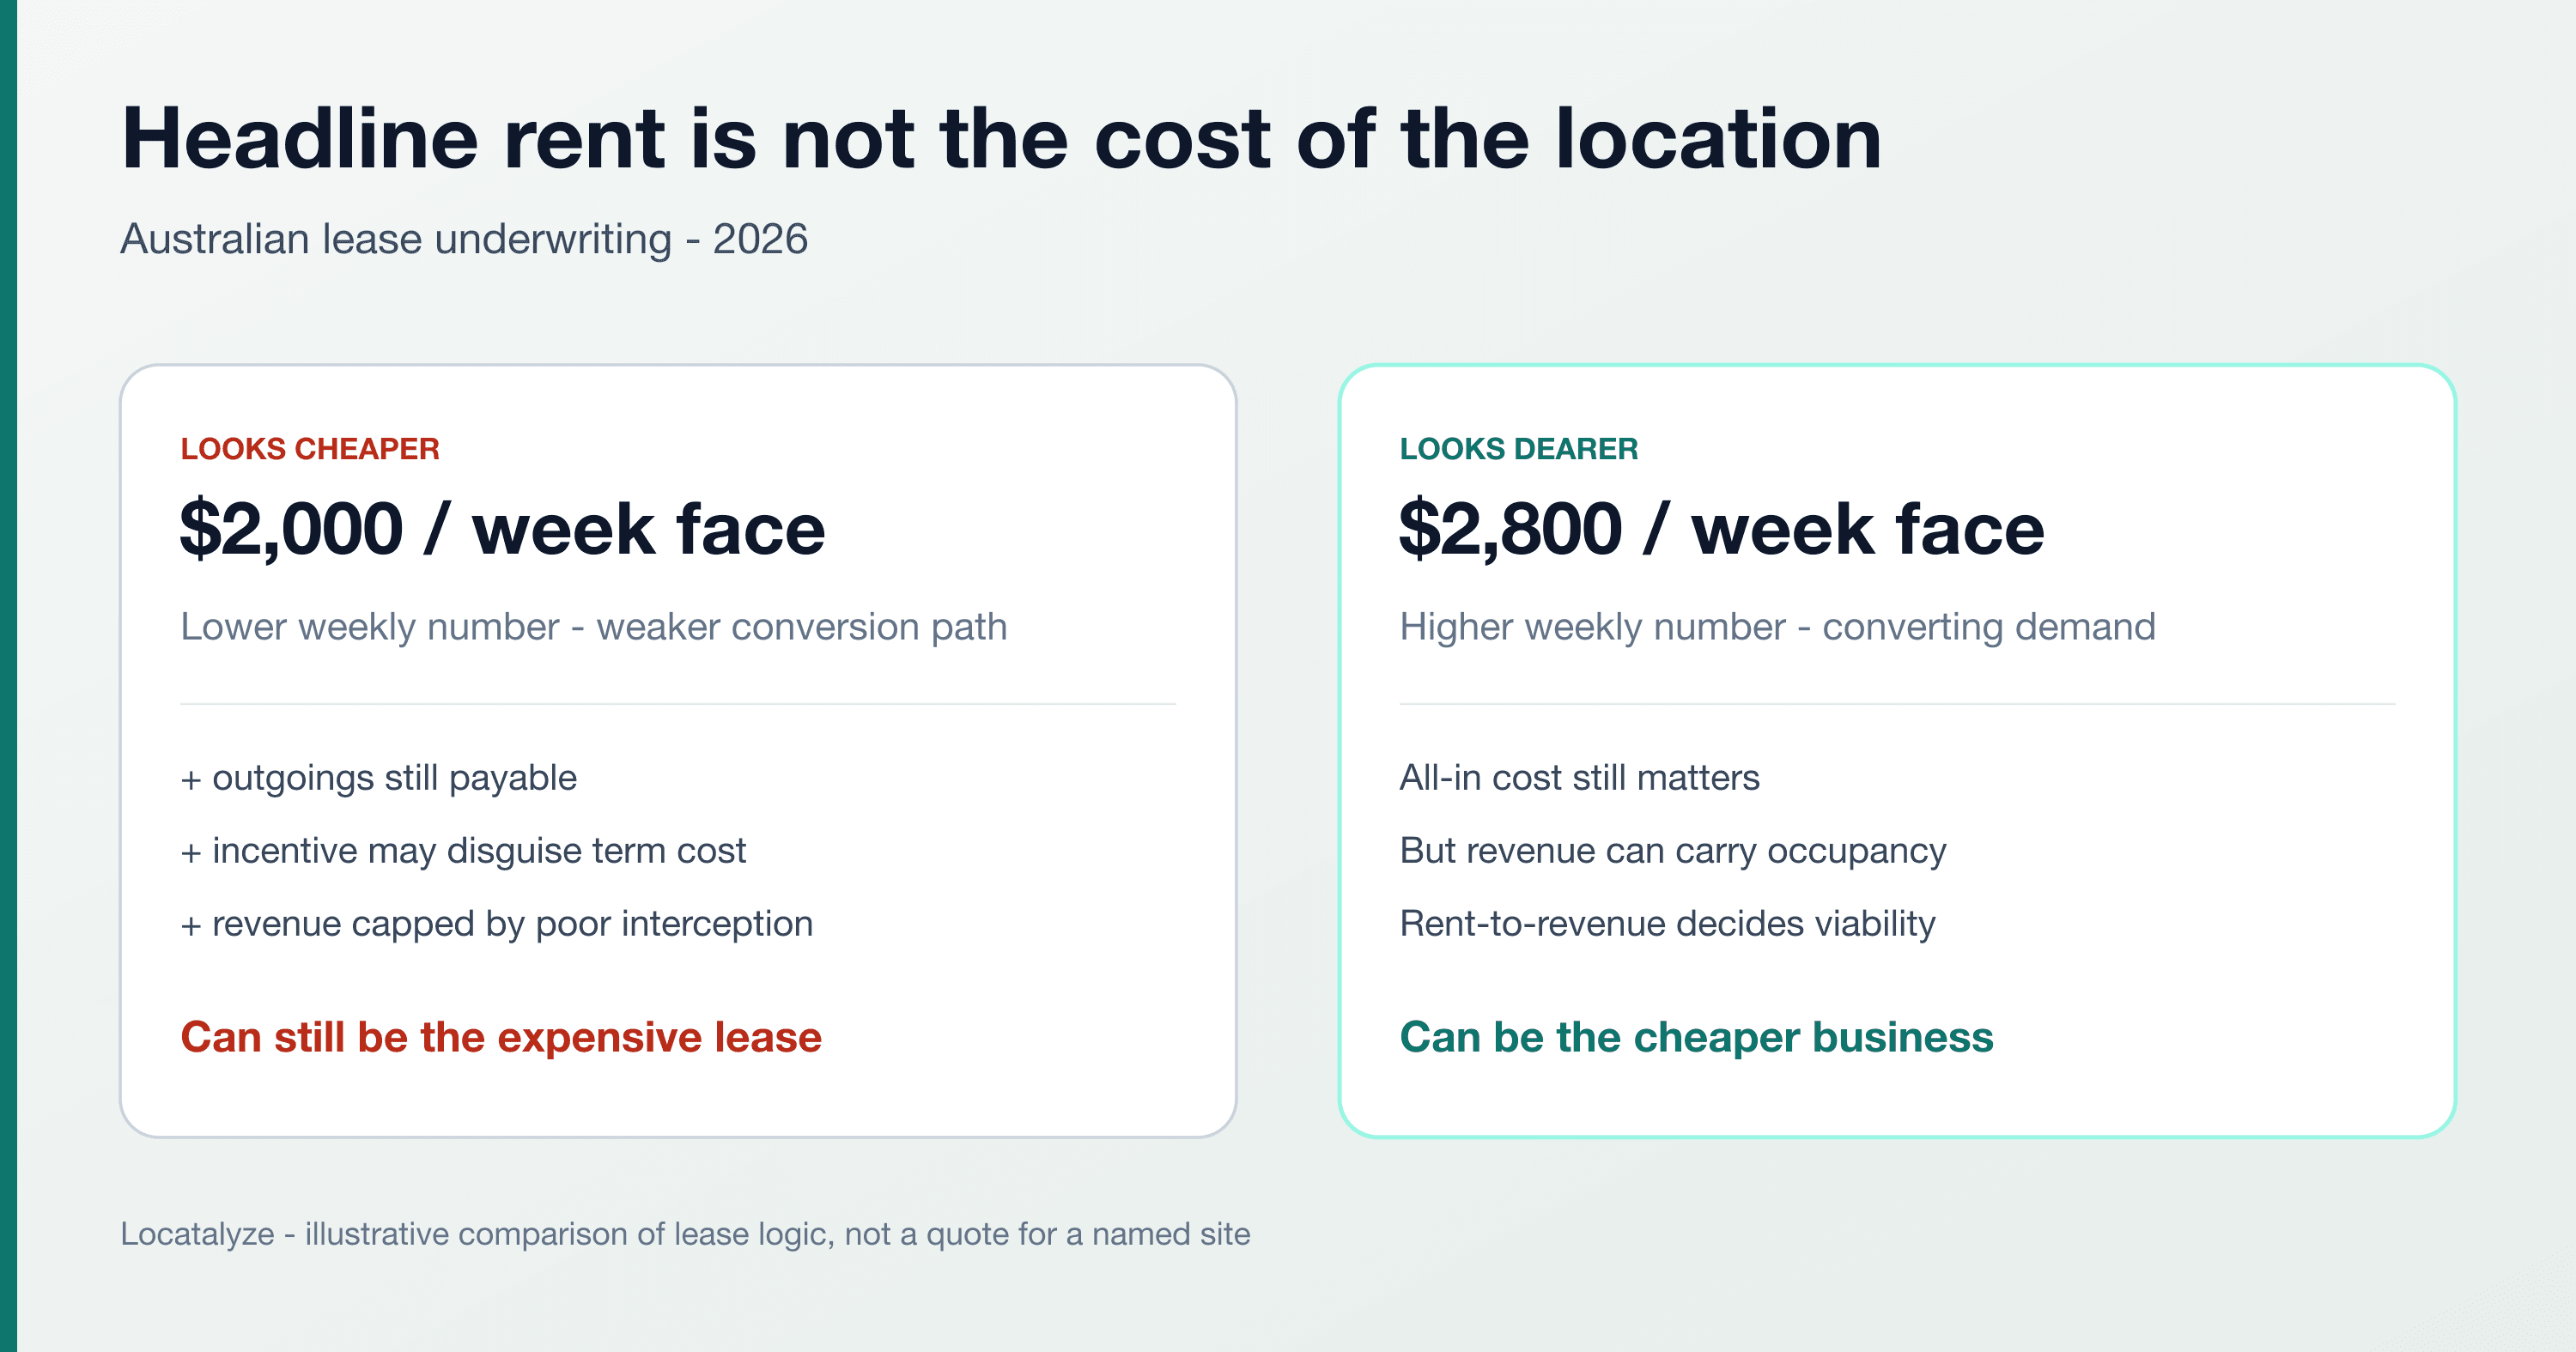
At 5.3% CBD retail vacancy, Sydney is not a market where empty shops are abundant bargaining chips. Colliers’ foot-traffic recovery and JLL’s office absorption both support weekday demand in the core. PROCEED only where the path and daypart are proven and the all-in occupancy ratio works — scarcity does not forgive a bad interception. Soft packages on fringe or secondary CBD frontages still need the underwriting discipline in why a cheaper lease can be the more expensive location.
Melbourne — do not misread the vacancy bump
Melbourne’s retail vacancy rose because new centres entered the survey with vacant floorspace, not because CBRE described a broad leasing strike. Office vacancy remains high at 20.5%. That combination tempts operators into two opposite errors: assuming every empty shop is a distress bargain, or assuming the whole CBD is dead. VERIFY the building, the centre absorption path, and whether your format needs weekday office workers that may still be thinner than Sydney’s. Evening and weekend destination formats can still work where the reason to visit is real — count those hours separately.
Brisbane — tight towers, still-elevated shop vacancy
Brisbane is the clearest warning against using office headlines as retail advice. JLL calls it the national office outperformer; CBRE still shows 16.7% CBD retail vacancy even after an 80 basis-point improvement. Lunch formats near proven worker paths may find a stronger case than discretionary retail hoping office tightness alone fills the room. Treat “Olympics narrative” and long infrastructure stories the same way we treat masterplans in the Maroochydore guide: upside case only, not year-one revenue.
Adelaide — improving, not automatic
Adelaide’s 130 basis-point retail vacancy improvement to 10.4% is the strongest CBD retail tightening in the CBRE set, and JLL shows a tenth consecutive quarter of positive office absorption. That is a genuine recovery signal. It still requires site-level counting. Improving city averages erase fewer bad frontages than operators hope.
Perth — recovery from a high base
Perth CBD retail vacancy eased only slightly to 18.5% — still the highest of the five capitals in the CBRE survey. Office vacancy improved to 16.0% in JLL’s Q2 read. PROCEED selectively where mining, public administration and services paths are observable; AVOID treating “eased 10 basis points” as a green light for any vacant retail shell.
Empty shopfronts are not bargains by default
In a recovery narrative, vacant CBD shops get marketed as timing opportunities. Sometimes they are. Often they are vacant because the daypart died, the centre circuit bypasses the door, the fit-out is a liability, or the rent still assumes pre-pandemic lunch peaks. Limited CBD retail supply over the past decade — CBRE notes CBD retail was only 4.2% of total retail supply — means vacancy is not being flooded by endless new strip stock nationally. When vacancy is high in a specific CBD, ask which blocks and which formats, not whether “the CBD” is on sale.
Before you celebrate a vacant CBD tenancy
PROCEED / VERIFY / AVOID
PROCEED
Weekday food and service formats on proven worker paths in tight retail cores (especially Sydney) where counted lunch demand already carries all-in occupancy. Experience-led F&B where evening or weekend destination reasons are observable without needing office attendance to do all the work.
VERIFY
Any Melbourne CBD deal priced off the national vacancy bump without checking whether the space sits in new-centre absorption. Brisbane retail hoping office tightness alone fills a weak frontage. Perth and higher-vacancy cores where “recovery” is still a high base. Any incentive-heavy CBD shell — soft packages still need the cheaper-lease test.
AVOID
Signing because a national article said CBDs are back. Using office vacancy as a retail forecast. Assuming an empty shopfront is underpriced. Modelling year-one revenue on tourism, events or future infrastructure you have not verified for that door.
A field protocol for CBD leases in 2026
Before heads of agreement
- 1
Write which clock your format depends on: weekday office, evening destination, weekend visitor, or resident catchment.
- 2
Count that clock on Tuesday, Thursday and Saturday — not only Friday inspection peak.
- 3
Place the city on the CBRE retail and JLL office maps so you know whether you are in a scarce core or a high-vacancy core.
- 4
If vacancy looks “helpful,” establish why the tenancy is empty and what failed before you.
- 5
Build all-in occupancy and the occupancy ratio against realistic revenue.
- 6
Set a failure trigger: minimum weekday transactions or covers that, if missed for a defined period, means the lease thesis is wrong.
For rent mechanics and incentive traps, keep commercial rent per sqm and the cheaper-lease guide beside this piece. For conversion risk when the street looks busy, read high foot traffic, low sales.
The decision rule
Australia’s CBDs are not uniformly empty and they are not uniformly healed. CBRE’s H1 2026 retail survey shows a national vacancy rise that is mostly Melbourne supply. JLL’s Q2 office data shows Brisbane and Sydney absorbing space while Melbourne office vacancy sits near 20%. Colliers shows Sydney foot traffic and hospitality-led CBD rent growth. Put together, the operator lesson is blunt: recoveries are local, format-specific and hour-specific.
Open when your daypart is already visible at the door and the occupancy maths works. Wait when the lease is priced for a finished recovery your counting cannot see yet.
Score the CBD frontage, not the national recovery story
Map competitors, access and demand around the exact tenancy before a city-wide headline becomes a fixed weekly cost.
Analyse the locationSources and verification notes
Primary and reporting sources accessed 29 August 2026
CBRE retail figures: national 10.8% (+40 bp) is consistent with CBRE’s H1 2026 insights landing and with opened Inside Retail / retailbiz trade reporting (24 Aug 2026). City splits used in this article follow the opened Inside Retail write-up. The downloadable CBRE PDF was not opened as a free ungated file from this environment (Cloudflare / subscribe gate). JLL office figures are from the opened JLL news release. Colliers CBD foot-traffic and rent direction are from the Q2 2026 retail snapshot. Full notes are in the repository sources file.
Related reading
Frequently asked questions
About the author
Prashant GuleriaFounder, Locatalyze
Prashant Guleria founded Locatalyze to help Australian operators separate market headlines from the daypart and frontage that actually pay the rent.
Tools first — then a full report for your address
Free rent, viability, and break-even checks. Upgrade when you are ready for competitors, map, and numbers for a specific site.
No signup required for tools