Foot traffic data is the most quoted number in a retail leasing conversation, and the one most likely to be wrong about the thing you actually care about. Here is the number an agent will hand you for a site on a strong strip: eighteen thousand pedestrians a day. It sounds like a verdict. It is closer to a rumour. The figure tells you that roughly that many bodies crossed a line on the footpath. It does not tell you which way they were walking, why they were out, whether they slowed down anywhere near the door, whether they match the people who buy what you sell, or whether a single one of them stopped.
Two sites can return the identical count and produce opposite businesses, and the count is structurally incapable of telling you which is which.
That gap is the subject here. Foot traffic data is not useless. It is the start of an analysis that most operators treat as the end of one. The count measures supply of bodies. Revenue comes from a chain of conditions the count never observes: the right people, travelling in a way that lets them stop, with a reason to stop, who then convert. Strip any link out and the headline number keeps looking healthy while the till stays quiet.
The thesis is blunt. Foot traffic without intent classification is decorative data. It populates a report and justifies a rent. It does not predict a revenue line, and treating it as if it does is how operators end up paying premium occupancy cost for a stream of people who were never going to come in.
The count was never designed to measure intent
This is not a new complaint. It is the oldest one in the discipline. The American Planning Association's foundational guidance on the technique, PAS Report 199, put the limit in writing in 1965: "the pedestrian count alone is rarely a sufficient basis for analyzing pedestrian traffic problems," and the "length and purpose of pedestrian trips" must "be supplied by other research techniques" (Emmons, *The Pedestrian Count*, APA PAS Report 199, 1965). The method counts volume and direction. Purpose sits outside its instrument. Sixty years of better sensors have not changed that, because it is a definitional limit, not a technological one.
You can see the limit in how the best public counters describe themselves. The City of Melbourne's pedestrian network, one of the most respected continuous datasets in the country, states plainly that "the system records movements, not images, so no individual information is collected" (City of Melbourne Open Data, Pedestrian Counting System). That is a privacy virtue and an analytical ceiling in the same sentence. Bi-directional movement through a zone, twenty-four hours a day, and not one field that says who the person was or why they were there.
Sydney's headline figure is built on an even thinner sample than most operators assume. The City of Sydney's walking counts cover "around 100 locations from 6am to midnight in fair weather conditions, on a weekday and a day on the weekend in March and October," and those counts "are carried out for 10 minutes every hour then multiplied by 6 to provide an approximate count for a whole hour" (City of Sydney, Walking counts). Read that again. The number that gets cited as authority is, at most sites, a ten-minute manual sample, extrapolated by six, on two fair-weather days a year. It is a reasonable estimate of volume. It is silent on everything else, and it was built to be.
None of this is a criticism of the councils. Their data is transparent about its method, which is more than can be said for most of what gets quoted in a leasing pack. The problem is the operator who takes a volume estimate and reads it as a demand forecast.
A count is not even a reliable count
Before we get to intent, it is worth dwelling on a smaller, dirtier truth: the count is often wrong about the count.
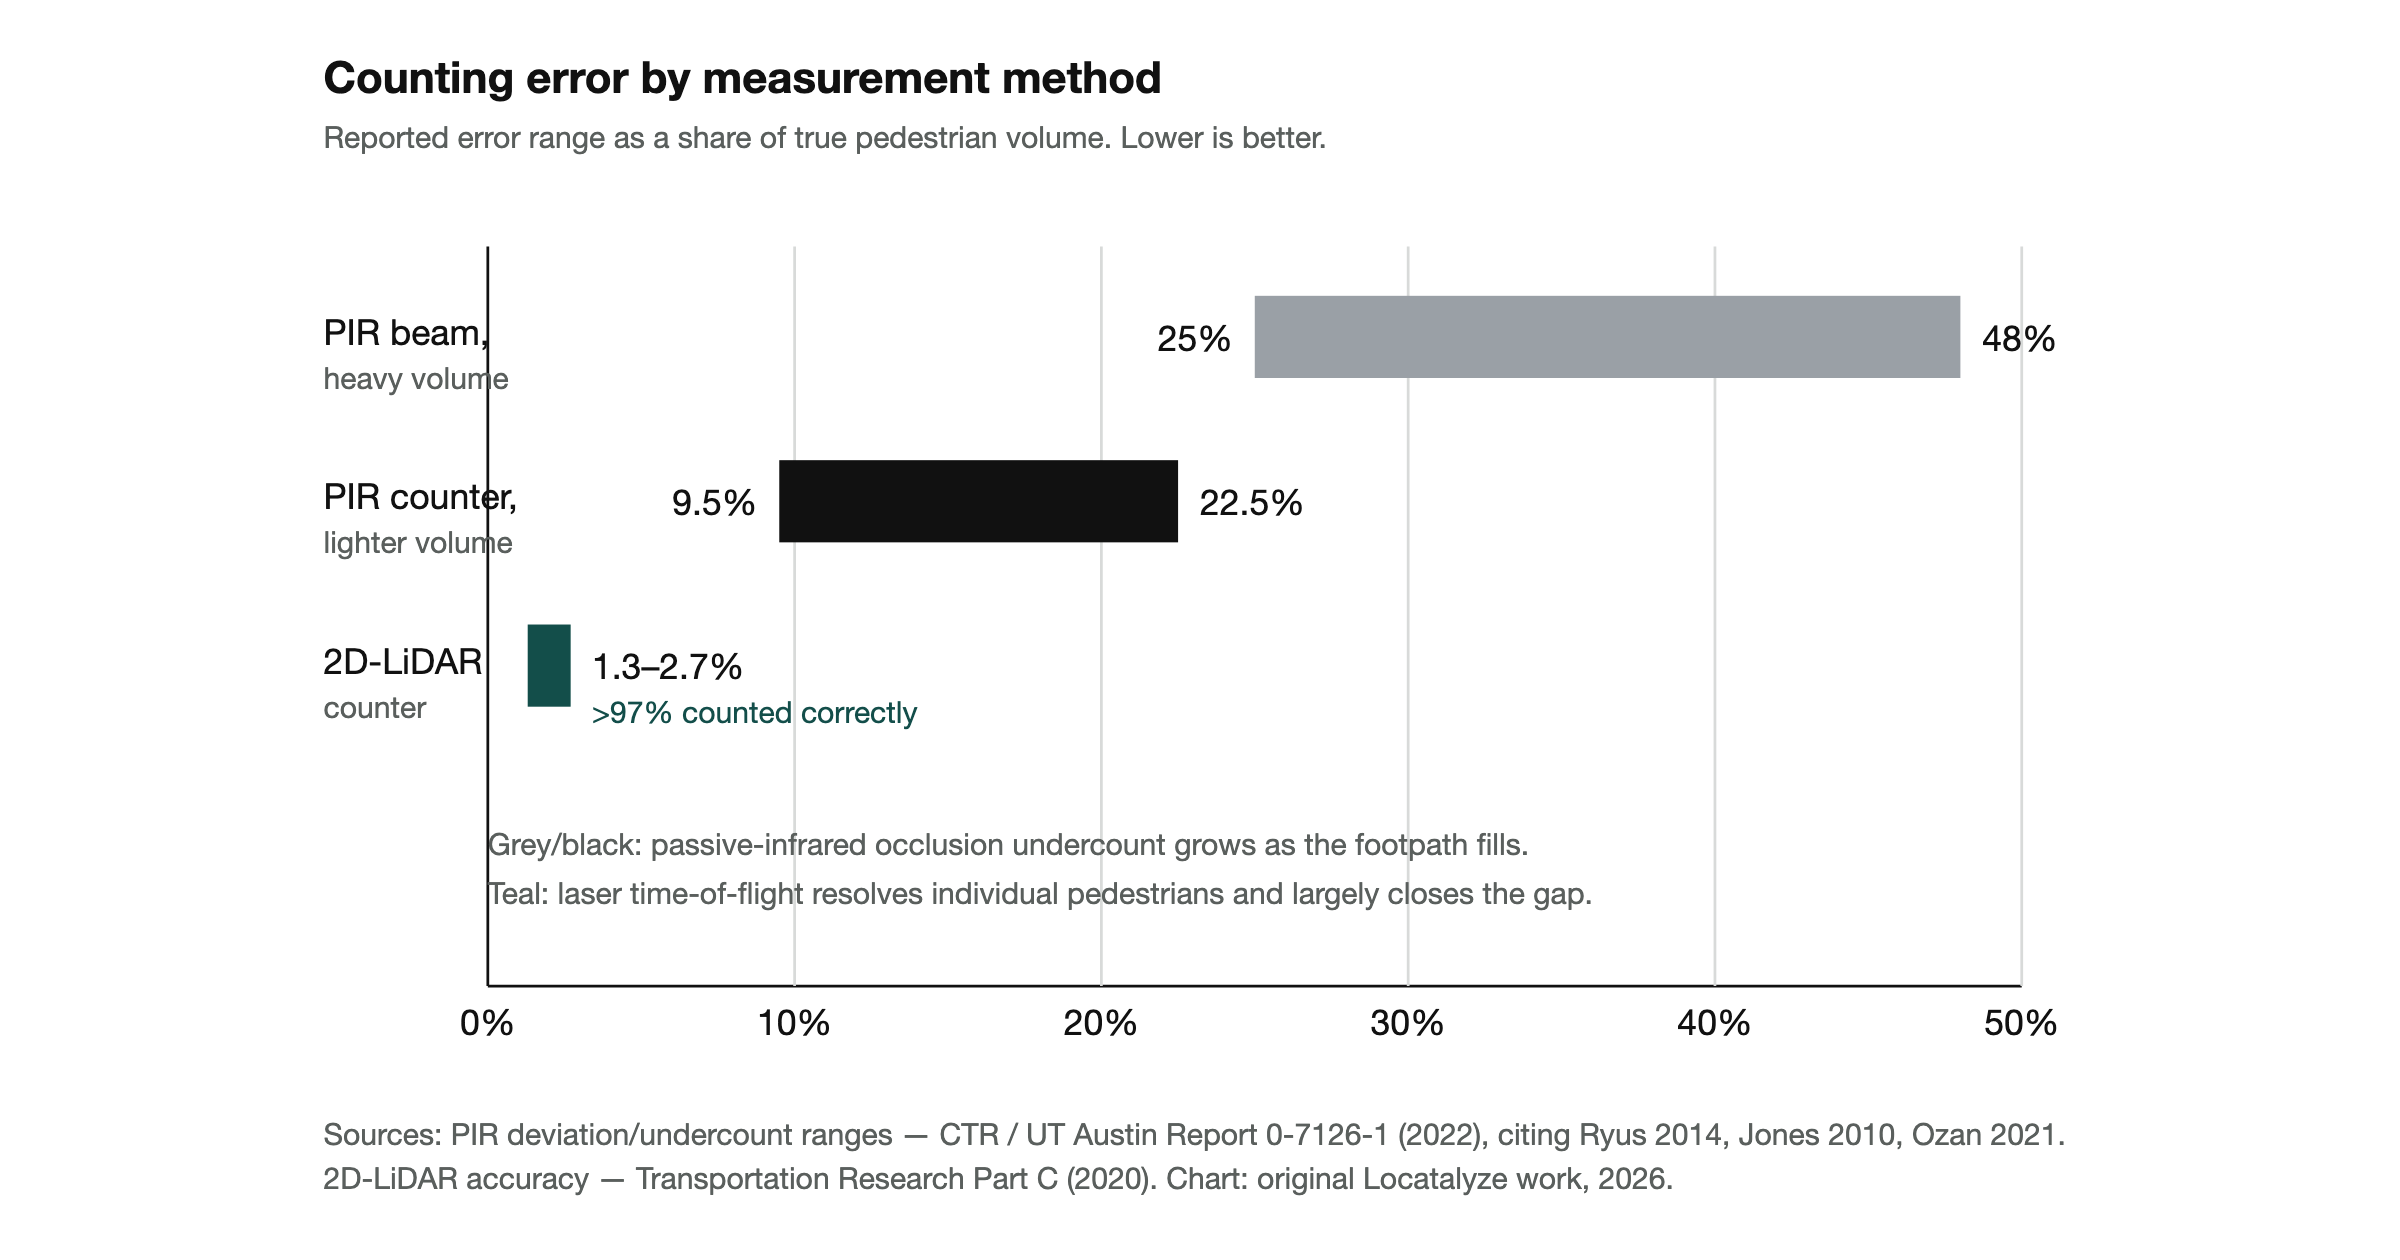
The most common automated sensor type, passive infrared, registers a beam-break event rather than a headcount, and it fails in a specific direction. The University of Texas Center for Transportation Research synthesis of pedestrian-counting technology found that passive infrared sensors are "notorious for undercounting, generally due to occlusion errors," that the "undercounting rate for passive infrared sensors increases with pedestrian volume," and that across the studies reviewed, "undercounting rates ranged between 25% and 48% for pedestrians" (Haddad et al., CTR / UT Austin, Report 0-7126-1, 2022). Occlusion means people walking in groups get read as one body. The error is not random noise that averages out. It is a systematic undercount that gets worse exactly where the location is busiest, which is to say exactly where you are most likely to be signing an expensive lease.
The ceiling is better but still bounded. A 2D-LiDAR system built for high-volume conditions counts "more than 97% of pedestrians" accurately, with a false-direction rate of 1.1 per cent (Bu et al., *Transportation Research Part C*, 2020, abstract). That is genuinely good engineering. It is also the point. The best instrument money can buy gets very close to perfect at counting bodies and measuring direction, and that is the entire extent of what it does. Perfect counting still says nothing about whether the foot stopped.
So the data quality conversation has two layers, and operators usually skip both. Layer one: is the count accurate as a count? Often it is a sample, an extrapolation, or an occlusion-prone undercount. Layer two, the one that matters more: even a perfect count is answering a question you did not ask.
What the count appears to say versus what it actually says
Most leasing decisions go wrong at the translation step, where a volume figure gets silently promoted into a demand figure. The table below is the translation done honestly: what each reading seems to promise, what it can actually support, the metric that answers the real question, and where that metric comes from.
The pattern across every row is the same. The left column is a quantity of bodies. The right column is a property of those bodies, or of how they behave at your specific door. The count can never cross that divide on its own, no matter how accurate it is.
The five things hiding inside one number
Direction and the meaning of a peak
A count at a single point sums both directions and both meanings. The morning side of a commuter flow and the evening side are the same eighteen thousand bodies and two entirely different markets. Someone walking toward the station at 8am, coffee-in-hand window open, is a different commercial proposition from the same person walking home at 6pm, errand list closed, wanting nothing. Direction of travel is recorded by good sensors. Trip purpose almost never is, and purpose is what turns a passer-by into a customer.
Intent, which the count cannot see at all
This is the load-bearing omission. A body in motion has a reason, and the reason determines spend. The commuter mid-leg does not stop for a forty-minute browse. The tourist three drinks into the afternoon does not buy office supplies. The parent on the school run has a fixed route and a closed wallet. Intent is invisible to a line-crossing sensor, and it is the single largest driver of whether volume becomes revenue.
Dwell, the difference between passing and stopping
Two frontages can sit on identical counts and split entirely on dwell time. A site where the median pedestrian slows to forty seconds near the window is a different asset from one where the median is six seconds of uninterrupted stride. Dwell is the physical precondition for conversion: nobody buys at a dead sprint. It is a separately modelled metric for a reason, which the vendors themselves concede.
Demographic match, not population
Volume is not the same as fit. A strip can carry a heavy count of exactly the wrong people for your format. The relevant question is not how many bodies pass but how many of the *right* bodies pass, and that is a catchment-composition question answered by census data, not a turnstile. We have written separately on why operators should read suburbs rather than count feet when the format depends on who lives and works nearby rather than who walks past.
Conversion, the metric that actually predicts revenue
At the end of the chain sits the only number that maps cleanly to a till: conversion, the share of passers-by who enter and buy. The arithmetic is standard, transactions divided by passers-by times one hundred, and it is where the foot-traffic figure either earns out or evaporates. Tellingly, even the firms that sell foot-traffic data say the count is not enough on its own. Placer.ai, a foot-traffic analytics vendor, markets itself as "the only solution to understanding the context of the visits in addition to the number of visits," and sells dwell time, visit frequency, trade area and demographics as the layers that matter beyond the raw figure (Placer.ai, Foot Traffic Analytics). When the people whose business is selling you the count tell you the count needs context, the context is the product and the count is the teaser.

An illustrative model, not measured field data. Two sites share the only field a sensor returns, an 18,400 daily count. Every row beneath it is a variable the count does not record, and those rows are what separate a viable site from an expensive one. Conversion figures are modelled for illustration.
How the panels actually work, and why "estimate" is the operative word
Mobile-device panels, the data behind most modern foot-traffic dashboards, do add the missing layers, but they buy that reach with a modelling assumption operators should understand before they trust the output. Placer.ai describes its panel as "tens of millions of mobile devices" that it "aggregated and extrapolated using proprietary algorithms and machine learning to provide accurate estimates of visits to any location" (Placer.ai, Our Data). The vendor's own analogy is the right one: the method works "much like a pollster might use a small sample size to generate insights about a much larger population." A panel figure is a poll, not a census. It carries sampling error, and the error is largest for small sites and thin categories, which is often precisely the independent operator's situation.
That does not make panels worthless. Dwell time and visit frequency are real, separately modelled metrics that a line-crossing count cannot produce, and they are closer to the revenue question than volume is. It means a panel number deserves the same scepticism as any poll: ask the sample size, ask the margin, and do not treat a modelled estimate as a measured fact.
Limitations, and what this analysis does not cover
A few honest boundaries. This piece does not put a number on conversion. Specific conversion-rate benchmarks circulate widely in vendor marketing, but we could not trace a credible figure to a primary dataset, so we have not cited one; the conversion *formula* is standard, the conversion *percentage* for your category is not something the open web reliably supplies. The claim that longer dwell correlates with higher purchase intent is intuitive and widely held, but we treat it as analyst judgement rather than cited evidence, because the studies asserting it are vendor-published. The pedestrian-count error figures come from transport research, some of it not Australian, and from sensor types that vary site to site, so treat the 25 to 48 per cent passive-infrared undercount as a range and a warning rather than a constant. Finally, the two-site model in the figure is a teaching device built to isolate the variables, not a measured pair of locations.
What survives all those caveats is the structural point, and it does not depend on any single number. A count measures bodies. Revenue depends on conditions a count cannot observe. The instrument and the question do not match.
What to do with this
Treat the foot-traffic figure as the first filter and never the last. A strong count earns a site a closer look; it does not earn it a signature. The work that actually de-risks the lease is the layer underneath: who is in the catchment and whether they match your format, which direction the peak flows and what those people are out to do, whether anyone slows down at the frontage, and what a realistic conversion looks like once you correct for all of it. Some of that is desk research on census composition. Some of it is an hour standing on the footpath at the hours that matter, watching whether feet stop. The companion to this argument, on why busy streets so often house failing businesses, works through the specific case where a big count and an empty till sit one block apart.
Before you weigh a quoted pedestrian number against a quoted rent, it is worth seeing how the address itself scores once demand, competition and rent viability are read together rather than in isolation.
Analyse your address →You can also start with the city-level location analysis and the precinct breakdowns for Sydney and Melbourne to see how the same count gets a different verdict depending on what surrounds it.
Common questions about foot traffic data
Does foot traffic data predict sales?
Not on its own. A pedestrian count measures how many bodies pass a point, not how many stop, who they are, or whether they buy. The metric that maps to revenue is conversion, the share of passers-by who enter and purchase, and it depends on dwell, intent and demographic match that the count never records. The foundational planning guidance made the limit explicit sixty years ago: a count gives volume and direction, while the purpose of a trip "must be supplied by other research techniques" (Emmons, APA PAS Report 199, 1965).
How accurate are pedestrian counters?
It depends entirely on the method, and the method is rarely disclosed alongside the number. Passive-infrared sensors, the most common automated type, undercount by 25 to 48 per cent through occlusion, and the error grows with crowd density, so it is worst exactly where the site is busiest (CTR/UT Austin, 2022). Purpose-built 2D-LiDAR counts more than 97 per cent of pedestrians accurately (Bu et al., 2020). Many headline council figures are a ten-minute manual sample extrapolated by six, taken on two fair-weather days a year (City of Sydney). Ask for the method and the sample window before you trust the figure.
What should I look at instead of foot traffic?
Four things the count cannot give you. The demographic match of the catchment to your format, which is a census question rather than a turnstile one. Dwell time at the frontage, which separates a forty-second pause from a six-second stride. The direction and purpose of the peak, which tells you whether the 5pm surge is a market or a commute. And a realistic conversion rate once you have corrected for the first three. The first is desk research on ABS data; the others come from an hour on the footpath or from modelled mobile-device panels.
Is mobile-device foot traffic data reliable?
It is a modelled estimate, not a census, and the vendors say so. Placer.ai describes its panel as "tens of millions of mobile devices" whose visits are "aggregated and extrapolated" into estimates, "much like a pollster might use a small sample size to generate insights about a much larger population" (Placer.ai, Our Data). That makes it a poll, with sampling error that is largest for small sites and thin categories. Panels add genuinely useful layers the raw count cannot, dwell and frequency and trade area among them, but the number deserves the scepticism you would give any poll rather than the trust you would give a measured fact.
References
Emmons, D. *The Pedestrian Count.* American Planning Association, Planning Advisory Service Report No. 199, June 1965. https://www.planning.org/pas/reports/report199.htm
City of Melbourne. *Pedestrian Counting System — Sensor Locations*, Open Data Portal. Accessed 31 May 2026. https://data.melbourne.vic.gov.au/explore/dataset/pedestrian-counting-system-sensor-locations/
City of Sydney. *Walking counts.* Accessed 31 May 2026. https://www.cityofsydney.nsw.gov.au/public-health-safety-programs/walking-counts
Haddad, A., Macias, M., Bhat, C., and Perrine, K. *Synthesis of Automated Pedestrian Data Collection Technologies.* Center for Transportation Research, University of Texas at Austin, Report 0-7126-1, October 2022. https://library.ctr.utexas.edu/ctr-publications/0-7126-1.pdf
Bu, F. et al. "Development and evaluation of a real-time pedestrian counting system for high-volume conditions based on 2D LiDAR." *Transportation Research Part C: Emerging Technologies*, February 2020 (abstract). https://www.sciencedirect.com/science/article/abs/pii/S0968090X1930083X
Placer.ai. *Foot Traffic Analytics* and *Our Data.* Accessed 31 May 2026. https://www.placer.ai/foot-traffic-analytics
Ryski, M. *Conversion: The Last Great Retail Metric.* (Referenced as framing for conversion as the decisive in-store metric; interior text not quoted.)
About the author
Locatalyze Research Team
Location intelligence, Locatalyze
The Locatalyze research team builds the location-scoring models behind the platform and writes up what the data shows for Australian operators.
Tools first — then a full report for your address
Free rent, viability, and break-even checks. Upgrade when you are ready for competitors, map, and numbers for a specific site.
No signup required for tools