The single most surprising cafe success factor in our Australia-wide suburb data is not which suburbs win. It is which variable predicts the score, and it is the one operators check last. Across 60 Melbourne suburbs where we hold factor-level data, the strength of a cafe location score tracks rent pressure more tightly than anything else we measure — a correlation of −0.58, negative, and larger in magnitude than demand, competition, seasonality or tourism (Locatalyze suburb model, 2026). Demand still matters at +0.49. Tourism, the thing operators talk about most when they walk a strip, sits at +0.18: the weakest signal in the set.
That is the headline finding of this study, and it cuts against how most cafe location decisions get made. The intuitive ranking puts visible foot traffic first, a desirable postcode second, and a tourist draw somewhere near the top. The measured ranking inverts it. Rent pressure — how hard the rent in a suburb pushes against the demand that suburb can actually support — is the dominant measurable driver in the model, and prestige postcodes are where rent pressure is highest. Two of Melbourne's most expensive addresses, Toorak and Armadale, score RISKY for cafes precisely because their rent pressure sits at 9 out of 10 while their cafe scores fall to 59 and 54 (Locatalyze suburb model, 2026). The prestige is real. The cafe maths is not.
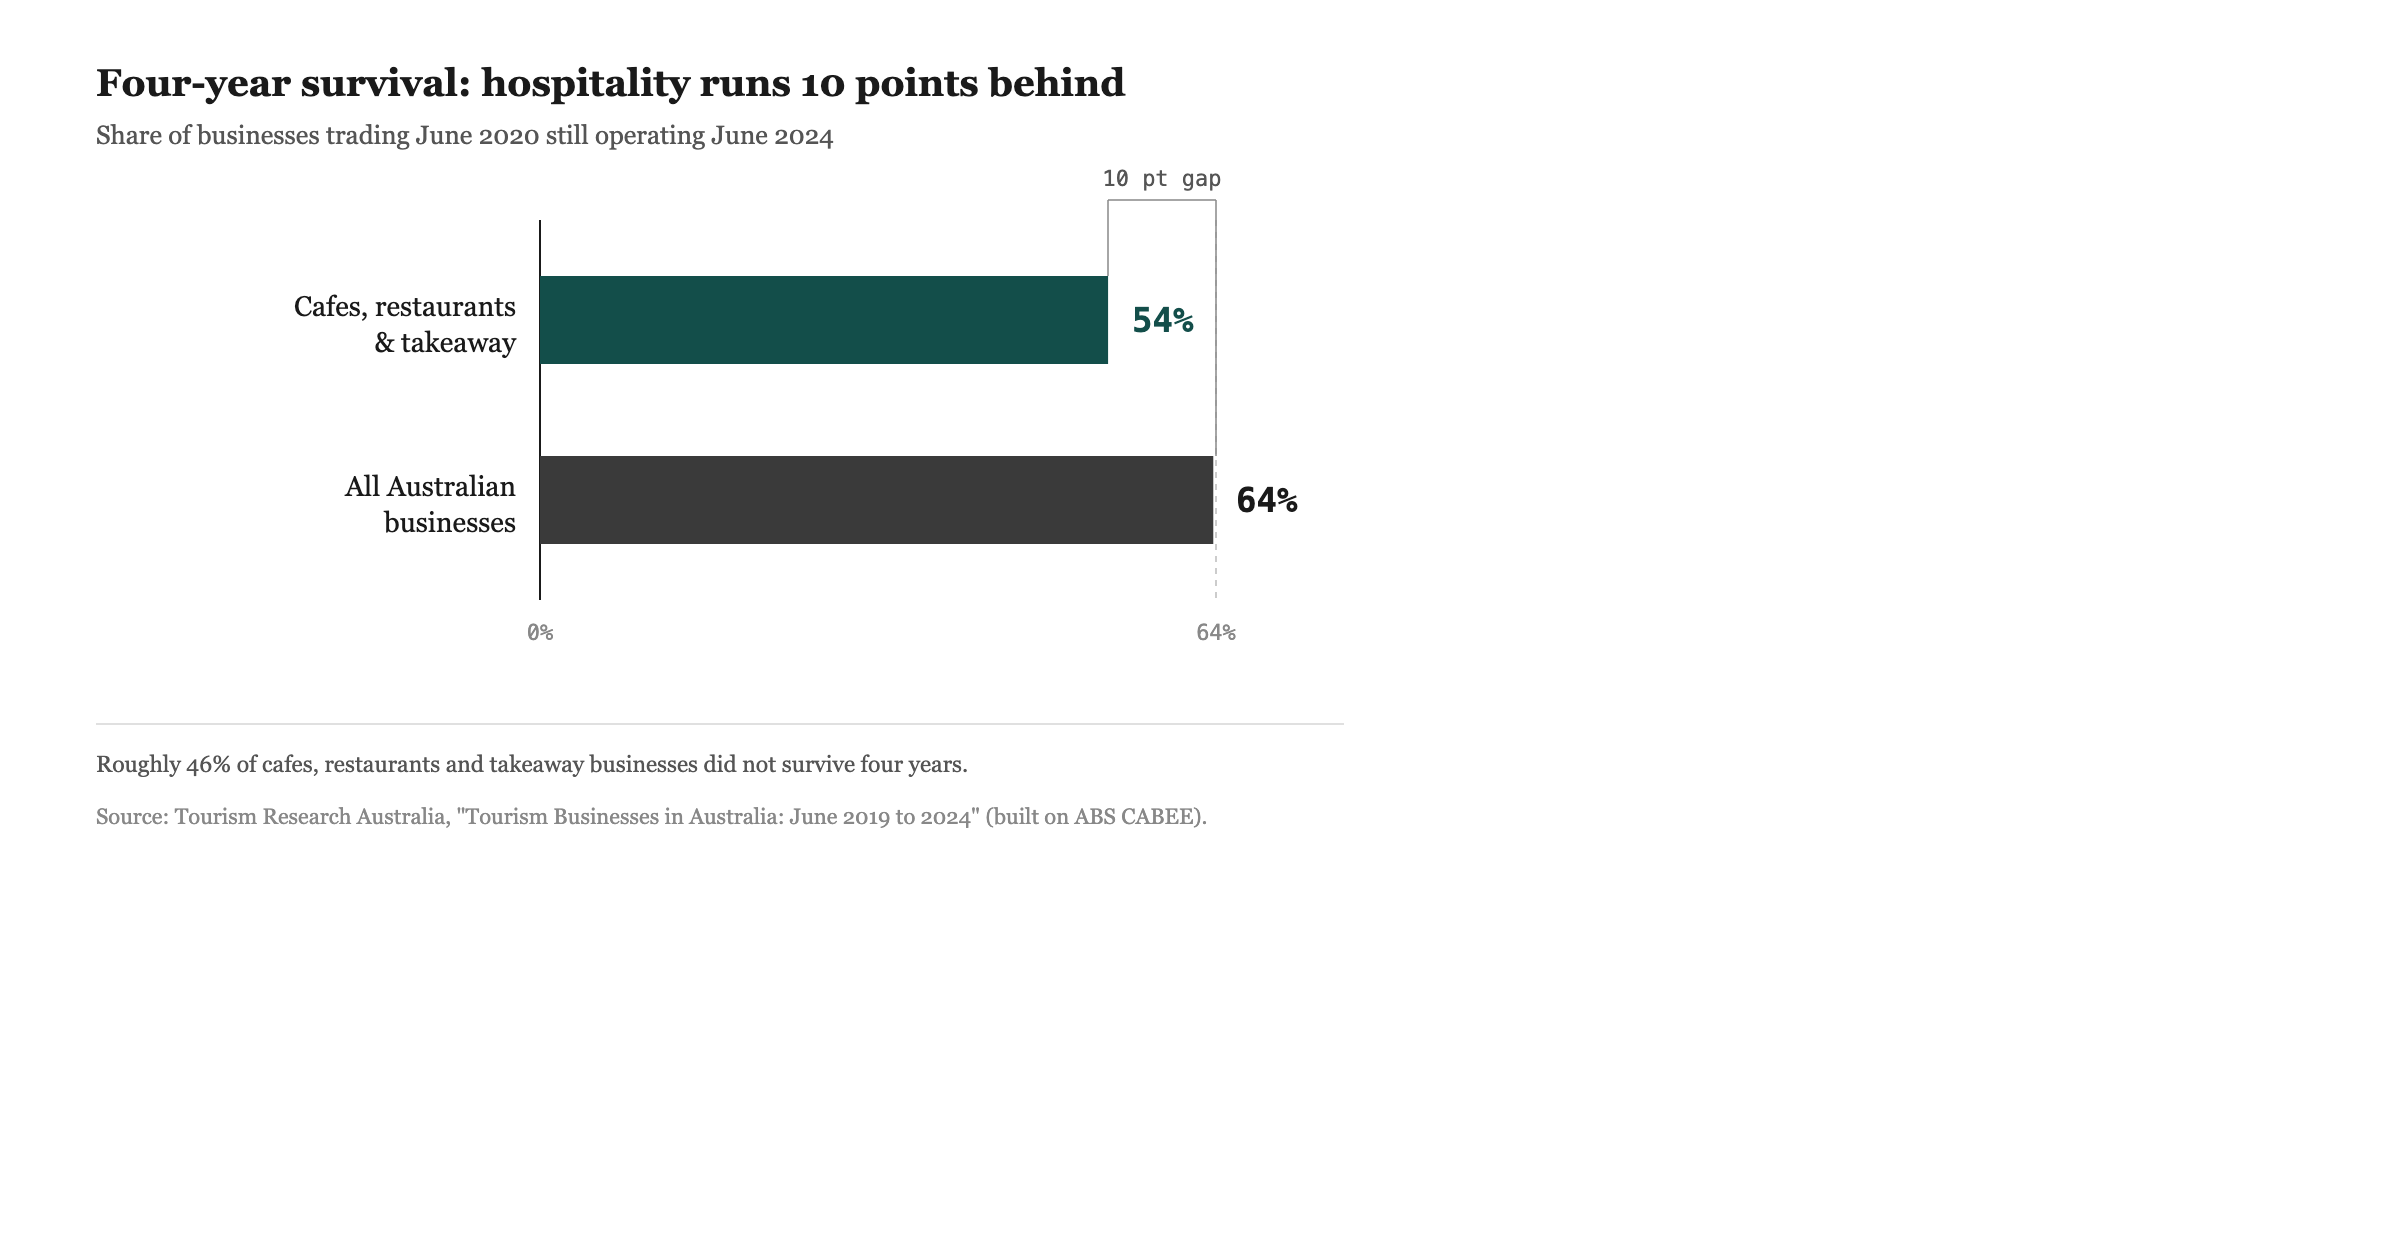
This matters because cafe failure in Australia is not a rare event. Accommodation and Food Services was the second-largest source of company insolvencies in FY2023-24, around 15 per cent of the national total, roughly 1,667 companies (ASIC, Annual insolvency data, FY2023-24). Cafe and restaurant businesses show about a 54 per cent four-year survival rate against roughly 64 per cent for all businesses (TRA / ABS CABEE). The cost of choosing the wrong suburb is paid in full, and it is paid often. So the question of what actually predicts a workable cafe location — rather than what feels like it should — is worth answering with numbers rather than instinct.
This is a research brief, not a sales page. It sets out what the suburb model contains, what it measures, what it cannot say, and what the patterns mean for the two groups who carry the risk: operators signing the lease, and the landlords and investors who own the buildings those leases sit in. Where a number comes from the model we label it as a model output; where it comes from an external dataset we cite that dataset. The two are not the same kind of evidence, and we keep them apart throughout.
Methodology: measuring cafe success factors across Australia
The Locatalyze suburb model covers 639 suburbs across 39 Australian cities. We describe the study as covering 500-plus suburbs because that is a conservative, defensible floor; the true coverage exceeds 600, and we have used the larger figure where the national count is the point. Coverage and depth are different things, though, and the distinction governs everything that follows.
National coverage is broad but shallow: every covered suburb carries a cafe location score and a verdict (GO, CAUTION or RISKY, the last surfacing in-product as NO). The deep factor data — the five sub-scores that let us ask *why* a score lands where it does — is richest for Melbourne, where all 60 covered suburbs carry values for demand, rent pressure, competition, seasonality and tourism, each on a 1-to-10 scale. So the correlation analysis in this brief runs on that Melbourne sample, n = 60. When we report a correlation coefficient, it is computed across those 60 suburbs. When we report a verdict mix or a single suburb's score, it can come from the wider set.
The five factors, briefly. Demand is the model's read on how much cafe spending a catchment can generate. Rent pressure is the headline variable: it expresses how hard commercial rent in the suburb presses against that demand, so a high score means rent is steep relative to what the local market can support, not merely that rent is high in dollar terms. Competition counts the density of existing cafes contesting the same spend. Seasonality measures how much trade swings across the year, which punishes suburbs that empty out in winter or out of tourist season. Tourism captures visitor-driven footfall.
The cafe location score blends these into a 0-to-100 number, and the composite score sits alongside it as a cross-business-type read. We then computed the Pearson correlation between the cafe score and each factor across the 60-suburb sample. Those five coefficients are the spine of this study, and they appear in the first chart.

Cafe success factors australia, ranked by correlation: rent pressure −0.58, demand +0.49, seasonality −0.38, competition −0.30 and tourism +0.18 across 60 Melbourne suburbs.
Two things this method does not do. It does not observe real cafe outcomes — openings, closures, turnover — at the suburb level; the model scores conditions, not results. And it cannot establish causation. A correlation of −0.58 between rent pressure and cafe score tells you the two move together in the model; it does not prove that rent pressure causes lower viability in the world, only that the model treats it as the heaviest weight and that the pattern is internally consistent. We return to both limits later, because they bound what any reader should take from this.
Finding 1: rent pressure beats demand as a driver
The instinct that demand rules cafe success is half right. Demand does correlate positively and strongly with the cafe score, at +0.49. But rent pressure correlates more strongly still, at −0.58, and it is the larger force in the model (Locatalyze suburb model, 2026). The practical reading is that a suburb's ability to generate cafe spending matters less than whether the rent lets an operator keep enough of that spending to survive.
This is the occupancy-cost problem stated in suburb terms. A high-demand suburb with steep rent can score worse than a moderate-demand suburb with gentle rent, because the rent claws back the advantage. The model encodes what experienced operators learn the expensive way: gross effective rent — base rent plus outgoings, net of any incentive — is the line that decides whether a strong revenue line turns into a strong net line. When demand and rent pressure pull in opposite directions, the model leans toward rent pressure.
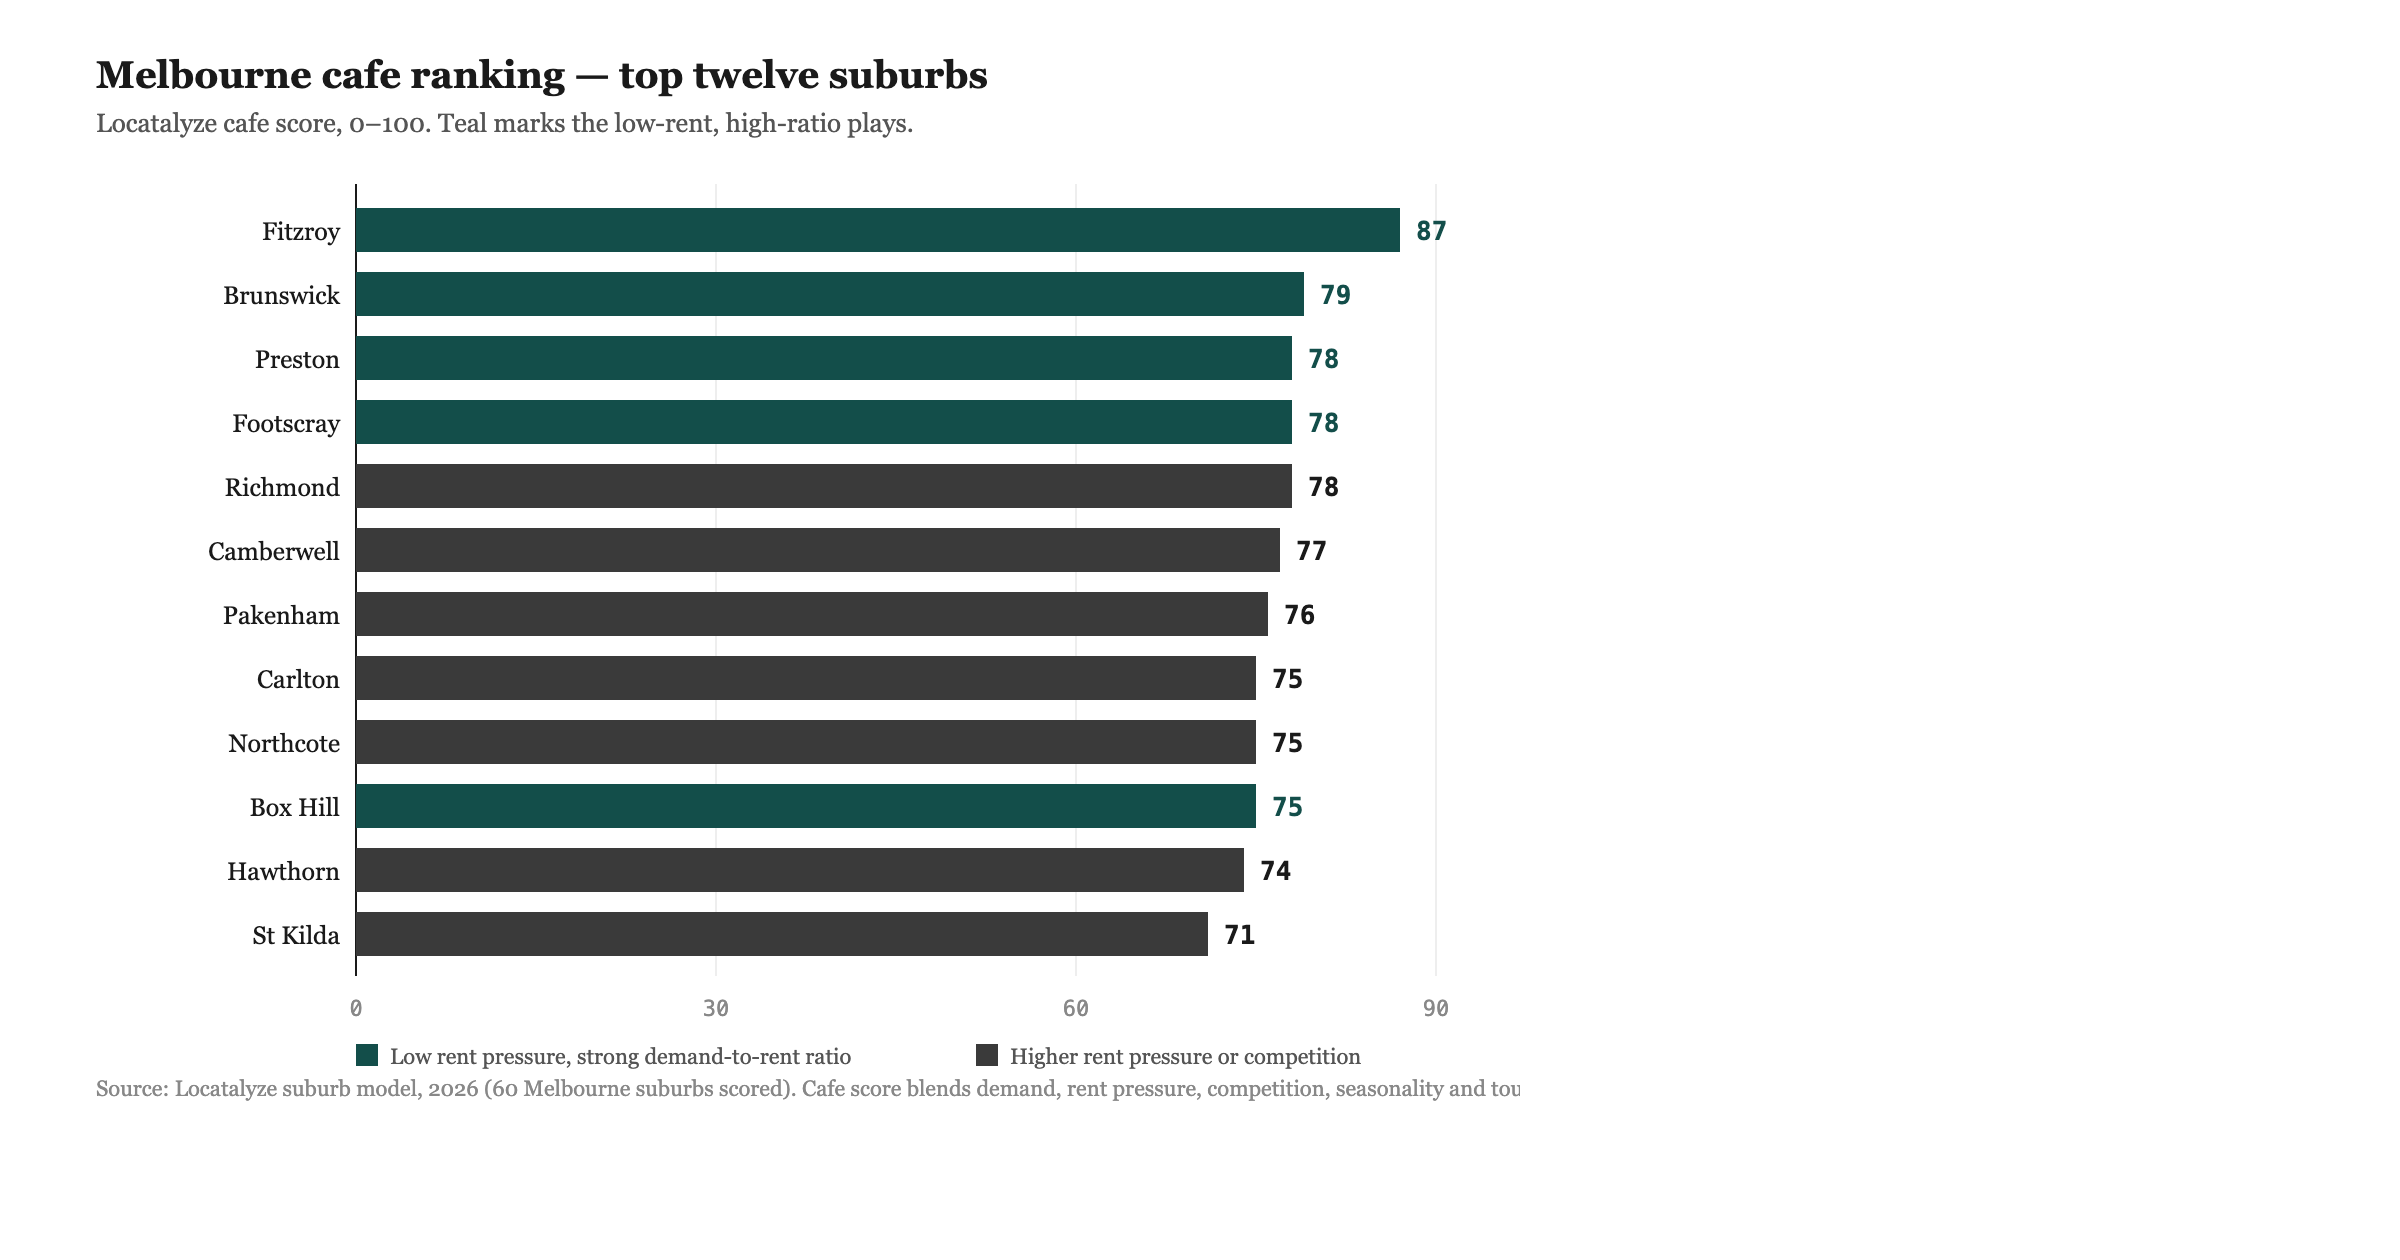
The clearest expression of this is the relationship in Figure 3, where the suburbs slope down from low rent pressure to high. Fitzroy sits near the top: demand 10, rent pressure only 4, cafe score 87, a clear GO (Locatalyze suburb model, 2026). It earns its score by pairing the model's maximum demand with rent that has not yet caught up to it. That gap — high demand, contained rent — is the cafe sweet spot the data keeps pointing back to.
Finding 2: tourism is the weakest predictor
Tourism is the factor operators raise first on a site walk and the factor the data ranks last. Its correlation with the cafe score is +0.18, the smallest in the set and barely distinguishable from noise across 60 suburbs (Locatalyze suburb model, 2026). A tourist draw helps a little. It does not carry a location.
The mechanism is not mysterious once you separate footfall from custom. Tourist footfall is high-volume and low-conversion for a neighbourhood cafe: visitors photograph the strip, buy one coffee or none, and move on, while the regulars who actually underwrite a cafe's week are locals on a routine. St Kilda, the most tourist-weighted suburb in the Melbourne set at tourism 8, scores a respectable cafe 71 — but it gets there on demand 9, not on the tourists (Locatalyze suburb model, 2026). The visitors are a top-up, not the engine.
For operators, the lesson is to discount the tourist story when pricing a site. A strip that lives on visitors carries seasonality risk and conversion risk at once, and the model's seasonality factor — correlating −0.38 with the cafe score — penalises exactly that volatility. The reliable cafe catchment is residential and habitual, not visiting and occasional. That is the opposite of how prime tourist pitches are usually marketed.
Finding 3: prestige postcodes can score RISKY
The finding that unsettles people most is that some of Melbourne's most desirable addresses are among its worst cafe bets. Toorak, a byword for wealth, returns a cafe score of 59 and a RISKY verdict. Armadale, its neighbour, scores 54, also RISKY. Both carry rent pressure of 9 out of 10 (Locatalyze suburb model, 2026). Prestige and cafe viability are not the same axis, and in these suburbs they point in opposite directions.
The reason is the rent-pressure mechanism again. Prestige postcodes command prestige rents, and a cafe cannot charge a prestige premium large enough to cover them — a flat white has a ceiling price that a Toorak boutique's handbag does not. So the suburbs where rent is highest relative to what a cafe can plausibly turn over are, by construction, the suburbs where rent pressure peaks. Demand in Toorak is a healthy 7, but rent pressure of 9 overwhelms it, and the cafe score falls into RISKY territory.
*Table 1. Five Melbourne suburbs showing how the demand-to-rent-pressure pairing, not prestige, drives the cafe verdict (Locatalyze suburb model, 2026).*
The scatter makes the whole shape visible. Plot every Melbourne suburb's cafe score against its rent pressure and the cloud slopes down from left to right, with the prestige names sitting low on the right.

Scatter of cafe location score against rent pressure for 60 Melbourne suburbs, sloping downward, with Fitzroy high at low rent pressure and Toorak and Armadale low at rent pressure 9.
A fuller picture of how Melbourne suburbs sort by demand and rent pressure sits in our companion piece on the Melbourne suburbs where cafes most often struggle; this brief stays on the factor analysis.
Finding 4: most of the market is CAUTION, not GO
The verdict distribution is its own finding. Of the 60 Melbourne suburbs, 16 score GO, 36 score CAUTION and 8 score RISKY (Locatalyze suburb model, 2026). The default state of a Melbourne cafe location is conditional — 60 per cent of the market lands in CAUTION, where a cafe can work but only on specific terms, and fewer than three suburbs in ten clear the GO bar outright.

Cafe verdict distribution across 60 Melbourne suburbs: CAUTION 36 suburbs or 60 per cent, GO 16 or 27 per cent, RISKY 8 or 13 per cent.
This is the realistic backdrop to the survival numbers. When the cafe and restaurant four-year survival rate runs around 54 per cent against 64 per cent for all businesses (TRA / ABS CABEE), and when the broader business exit rate sat at 13.9 per cent in 2024-25 (ABS, Counts of Australian Businesses, 2024-25), a market where most suburbs are merely conditional is consistent with an industry where roughly half of new entrants do not reach year four. CAUTION is not a soft no. It is an instruction to do the work, model the occupancy cost and stress-test the quiet season, before committing.
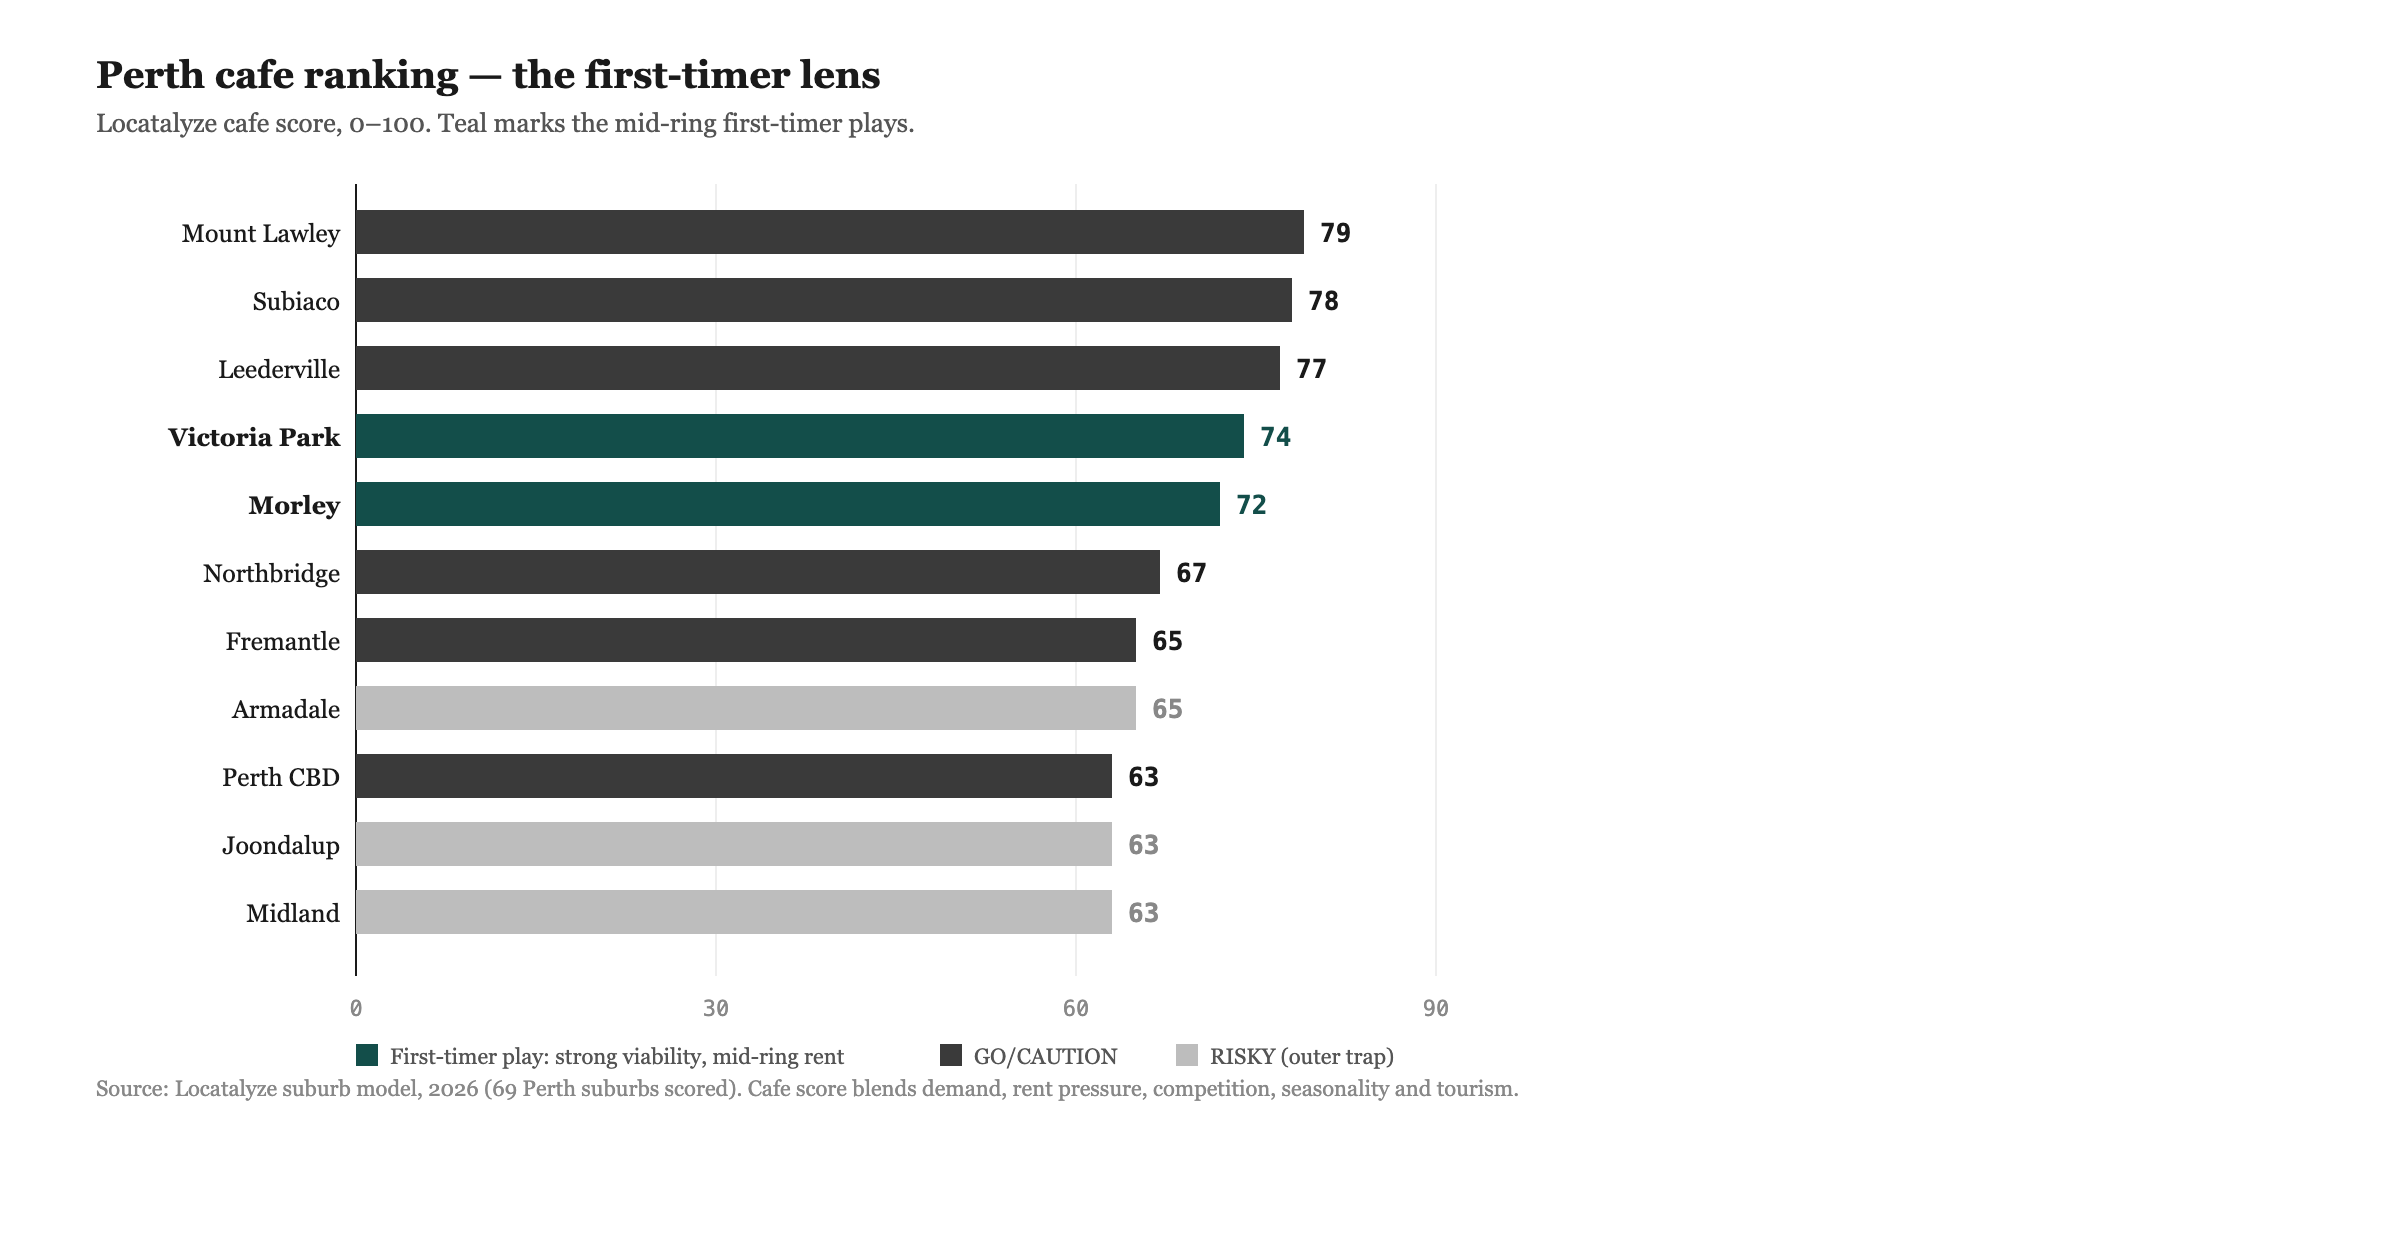
Perth tells the same story in a different key. Of 69 covered Perth suburbs, only 6 score GO, 59 are CAUTION and 4 are RISKY, with Mount Lawley topping the market at a cafe score of 79 (Locatalyze suburb model, 2026). The conditional middle is even larger there. A reader weighing the two cities can compare them directly through the Melbourne suburb analysis and the Perth suburb analysis, which carry the per-suburb detail behind these counts.
Finding 5: what operators rank versus what the data ranks
Put the two orderings side by side and the gap is the whole story. The common operator ordering leads with foot traffic and demand, then postcode prestige, then tourism, with competition and rent further down. The data ordering by correlation strength leads with rent pressure, then demand, then seasonality, then competition, with tourism last (Locatalyze suburb model, 2026). Rent climbs from the bottom of the intuition list to the top of the data list. Tourism falls from near the top to the floor.

Slope chart comparing the operator-intuition ranking of cafe factors with the data ranking by correlation strength, showing rent rising from last to first and tourism falling from third to last.
Seasonality is the quiet revelation in that chart. It correlates −0.38 with the cafe score, third strongest, yet it rarely features in how operators size up a strip at all. A suburb that trades hard in summer and hollows out in winter punishes a fixed rent and a fixed wage bill, and the model reads that volatility as a real drag. Operators who ignore it sign annual leases against seasonal revenue and discover the mismatch in their first July.
Finding 6: low rent pressure is doing the work in unglamorous suburbs
The flip side of the Toorak pattern is that several unfashionable suburbs score GO on the strength of contained rent, not roaring demand. Preston and Footscray each carry demand of 8 — solid, not spectacular — but rent pressure of just 3, and both land cafe scores of 78 with GO verdicts (Locatalyze suburb model, 2026). Pakenham, further out, posts demand 7 and rent pressure 3 for a cafe 76 GO. These are not the suburbs that win a coffee-culture beauty contest. They win the rent-pressure test, and in this model that is most of the game.
For an operator, this reframes the search. The instinct is to chase the suburb with the strongest visible buzz, which is usually the suburb with the steepest rent and the most existing cafes. The data points toward the suburb where demand is adequate and rent has not yet been bid up to meet it — the gap between the two is where margin lives. That gap closes as a suburb gentrifies, which is why timing the entry matters as much as picking the postcode.
Limitations: what this study cannot say
Several limits bound every claim above, and they are not throat-clearing.
The model scores conditions, not outcomes. It is not a census of cafe openings and closures. A cafe score of 87 in Fitzroy means the conditions there are favourable by the model's logic; it does not mean a given cafe will succeed, nor that one in a RISKY suburb must fail. Operators inside the same suburb diverge enormously, and the model has nothing to say about an individual's product, pricing or operations.
Correlation is not causation. The −0.58 between rent pressure and the cafe score describes how the two move together in the model. It is consistent with rent pressure being a genuine driver of cafe outcomes, and the mechanism is plausible, but this study does not prove the causal arrow. Rent pressure and weak cafe viability may both flow from a third factor the model bundles into its inputs.
The factor data is deepest in Melbourne. The correlation analysis rests on n = 60 Melbourne suburbs. Sixty is enough to detect a relationship of this strength, but it is one city, and the patterns may shift in markets with different rent structures or different residential densities. The Perth verdict mix is consistent with the Melbourne picture, but we have not run the same factor-level correlations there, so we do not claim them.
The factor scores are themselves model estimates, not measured quantities. Rent pressure of 9 in Toorak is the model's read, assembled from listings and demand signals, not a single observed rent. Treat the scores as a calibrated opinion, useful for ranking and comparison, not as ground-truth measurements. And the external survival and insolvency figures we cite (ASIC, TRA, ABS) describe the industry at large; they are context for why suburb selection matters, not validation of any specific suburb score.
Implications for operators
The operating takeaway is to reorder the checklist. Lead with rent pressure, expressed as occupancy cost: model conservative revenue first, then divide gross effective rent plus outgoings by it, and walk away from sites where that ratio is uncomfortable even in a quiet quarter. Demand is the second question, not the first, and prestige is not on the list at all except as a warning that rent pressure will be high.
Discount the tourist story. A strip that lives on visitors carries conversion risk and seasonality risk together, and the data ranks both above tourism's thin positive signal. Price the slow season in before signing, because seasonality is the third-strongest factor and the one operators most often ignore. And read a CAUTION verdict as an instruction rather than a verdict — most of the market is conditional, and the condition is almost always the rent.
The micro version of this whole argument is worth reading alongside the macro: our teardown of whether a cafe could survive at 100 William Street in Perth runs the same rent-pressure logic against one specific address rather than 600 suburbs, and the two pieces are designed to be read together — the study sets the pattern, the teardown shows it biting on a single lease.
If you want the same factor analysis run against your own shortlisted address, that is what the onboarding flow exists to produce: an address, a business type, a rent figure, and the model returns the verdict and the reasoning behind it.
Analyse your address →Implications for landlords and property investors
For landlords and investors, the rent-pressure finding is a tenant-durability signal, and it should change how a cafe tenancy is underwritten. A rent that maximises the headline lease number can minimise the probability the tenant survives to pay it. The model's −0.58 says, in landlord terms, that pushing rent past the point the local cafe market can bear does not just risk a vacancy at renewal — it raises the odds of a default inside the term. Gross effective rent that looks strong on the schedule can be weak on a risk-adjusted basis once you price in the elevated failure rate of hospitality tenants (ASIC, Annual insolvency data, FY2023-24; TRA / ABS CABEE).
The prestige-postcode pattern carries a specific warning for owners of retail in suburbs like Toorak and Armadale. High-rent strips select for tenant types that can clear the rent — and a neighbourhood cafe is structurally not one of them. An owner who insists on a cafe at a prestige rent is underwriting a tenant whose business model the location works against, which shows up later as turnover, incentive costs and re-letting voids. The more durable hospitality tenancy sits in a suburb where rent pressure is moderate and demand is adequate, the Preston and Footscray profile, even though those addresses carry less prestige and, often, a lower headline rent.
There is a portfolio reading too. The verdict distribution — most suburbs CAUTION, few GO — means cafe-anchored retail income is conditional across most of the market, and a landlord's real protection is not a higher rent but a tenant whose occupancy cost leaves room to absorb a bad quarter. Investors screening retail assets can use the same suburb-level rent-pressure read operators use, through the location analysis tool, to flag where a cafe tenancy is being asked to carry a rent its catchment cannot support. The asset's value rests on the lease being paid through a full cycle, and that is a function of the tenant's margin, which is a function of rent pressure. The benchmarks behind these rent comparisons are set out in our piece on commercial rent per square metre across Australia.
References
Locatalyze suburb model, 2026. Cafe location scores, verdicts and factor sub-scores (demand, rent pressure, competition, seasonality, tourism) across 639 suburbs in 39 cities; factor-level correlation analysis on n = 60 Melbourne suburbs. First-party engine output, accessed 2026-05-31.
ASIC, *Australian insolvency statistics*, FY2023-24. Accommodation & Food Services the second-largest source of company insolvencies, ~15% of the total (~1,667 companies). asic.gov.au
Tourism Research Australia, analysis of ABS Counts of Australian Businesses (CABEE). Cafe/restaurant four-year survival ~54% versus ~64% for all businesses. tra.gov.au
Australian Bureau of Statistics, *Counts of Australian Businesses, including Entries and Exits*, 2024-25. Business exit rate 13.9%. abs.gov.au
CBRE Australia, retail market figures. Used for occupancy-cost and rent framing. cbre.com.au
The Locatalyze model covers 639 suburbs across 39 cities. "500+" is used as a conservative, true subset claim in the headline; actual coverage exceeds 600. The deep factor analysis is confined to the 60 Melbourne suburbs that carry factor-level sub-scores (n = 60).
About the author
Locatalyze Research Team
Location intelligence, Locatalyze
The Locatalyze research team builds the location-scoring models behind the platform and writes up what the data shows for Australian operators.
Tools first — then a full report for your address
Free rent, viability, and break-even checks. Upgrade when you are ready for competitors, map, and numbers for a specific site.
No signup required for tools