Best Suburbs to Open a Restaurant in Brisbane — Match Format to Precinct
Founder, Locatalyze
“Best suburb” is the wrong question until we know your average spend, trading hours, and whether you need Tuesday lunch or Saturday theatre spikes. Brisbane is not one dining market — it is night-economy valleys, premium James Street expectations, South Brisbane show-time pulses, and neighbourhood strips where loyalty beats Instagram. Below is the roadmap we use internally: precinct personalities, indicative rent pressure bands, comparison logic (West End vs Milton vs Bulimba), and blunt guidance on who should pursue each corridor.
Evidence standard
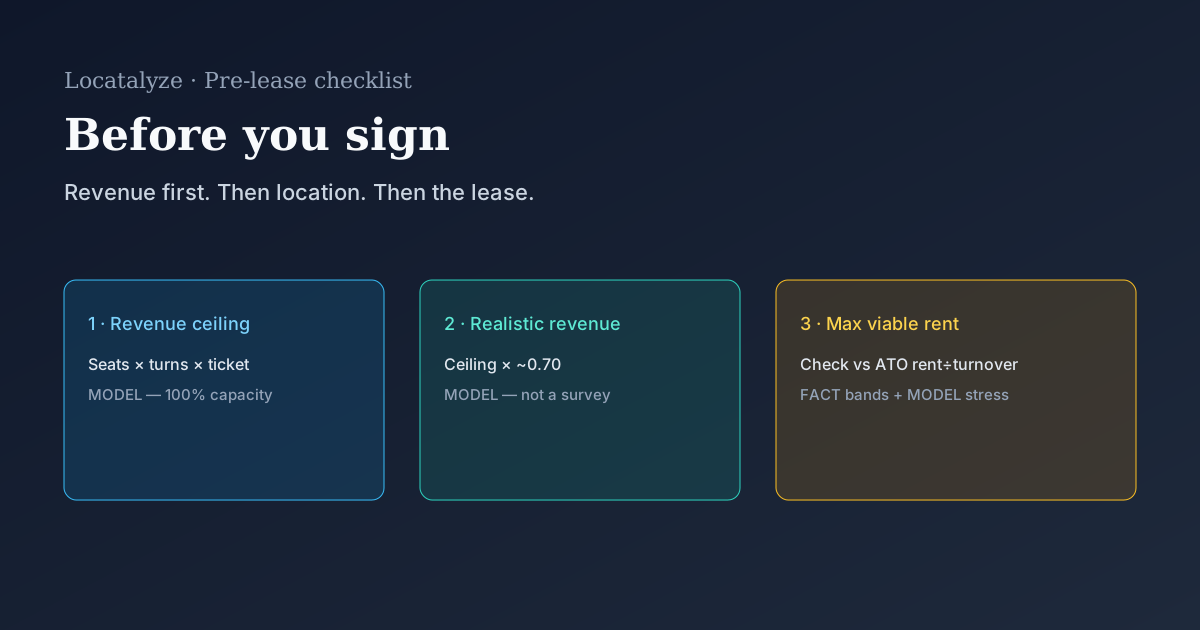
Suburb/precinct guidance below is LOCATALYZE ANALYSIS for Brisbane restaurant formats — not ABS closure rates and not a street-level census. Rent and competition callouts without an opened primary $/sqm table are ESTIMATE brackets — verify with current listings. Use /analyse/brisbane for address-level reads. Cross-check occupancy maths with ATO small-business rent÷turnover bands where the format is coffee-adjacent, and with the national [before you sign](/blog/before-you-sign-that-lease-checklist-restaurant) checklist.
$2,114/wk
FACT: West End (Brisbane) median weekly household income — ABS Census 2021 QuickStats SAL33033
$1,658/wk
FACT: Fortitude Valley median weekly household income — ABS Census 2021 QuickStats SAL31074
14,730
FACT: West End (Brisbane) usual resident population — ABS Census 2021 SAL33033
$2,805/wk
FACT: Bulimba median weekly household income — ABS Census 2021 QuickStats SAL30412
Residential income is not dining demand by itself — Fortitude Valley’s night economy pulls from a much wider catchment than its resident count — but ABS QuickStats stop you treating every Brisbane strip as interchangeable. West End’s higher resident income and density support neighbourhood repeat trade; the Valley’s lower resident household income is compatible with entertainment-driven covers if weekday lunch is honest. Numbers: West End QuickStats, Fortitude Valley QuickStats.
Pick your restaurant shape first — suburb second
Fast-casual lunch needs reliable CBD-adjacent workers or institutional anchors. Premium dining needs disposable income within a sane drive time plus parking tolerance. Late-night formats need aligned liquor ecosystems and security economics that do not swallow margin. If you mismatch shape and suburb, you will blame “Brisbane” when your lease never matched your dayparts.
Table provenance: rent pressure, dayparts and risks are LOCATALYZE ANALYSIS for restaurant formats — not CBRE $/sqm averages and not a closure census. Confirm face rent, outgoings and incentives on the listing.
Fortitude Valley — volume and volatility in the same sentence
The Valley can deliver revenue per seat hour that suburbs cannot — but it invoices you in security, noise constraints, and roster complexity. Wednesday lunch matters as much as Saturday night: many failures come from founders who model peak nights and staff quiet Tuesdays like peaks still happen. If your concept cannot survive a wet weekday, do not let weekend euphoria choose your lease.
James Street — premium tolerance or premium punishment
James Street customers arrive with comparison shopping built in — your wine list, pacing, and consistency are judged against established anchors immediately. Rent reflects that scrutiny. This is a suburb for operators who already know their gross profit per cover at scale — not first-restaurant experiments unless capital cushions are deep.
South Brisbane — culture spikes are not a business model alone
Shows and festivals create spikes that feel incredible — then vanish. Model January quietly; model non-event Thursdays ruthlessly. If fixed labour cannot flex down, spikes become dangerous mirages.
West End — fierce overlap, honest opportunity
West End rewards differentiated cuisine with disciplined COGS — not another “modern Australian share plate” unless execution is elite. Weekday locals stabilise trade if you earn loyalty; tourists amplify weekends. Negotiate rent understanding cuisine density within 500m — overlap kills undifferentiated entrants.
Neighbourhood bays — Bulimba, Hawthorne, Paddington pockets
Neighbourhood restaurants trade repeat visits over raw pedestrian totals. FACT: Bulimba’s median weekly household income was $2,805 at Census 2021 (SAL30412) — well above Queensland ($1,675) and Australia ($1,746) medians (ABS QuickStats Queensland, Australia) — which supports premium neighbourhood dining if parking and school-run logistics work. Parking and school logistics still shape Tuesday dinner more than Instagram. Choose these corridors when your concept embraces community rhythms rather than tourist discovery. Bulimba QuickStats.
Field check before you shortlist (operator practice)
Before treating any Brisbane precinct as GO: (1) count Tuesday lunch and Thursday dinner yourself for 20–30 minutes; (2) map cuisine overlap within ~500 m; (3) ask whether mid-week covers clear wages after rent; (4) pull ABS QuickStats for the exact SA2/SAL — not a brochure suburb name. Spikes from Valley nights or South Brisbane shows are VERIFY, not the base case.
Worked covers maths — why Brisbane breaks budgets quietly
MODEL: $14,000/month all-in rent targeting ~12% occupancy load implies ~$117,000/month turnover. At $42 average spend you need ~2,786 covers/month — about 107 covers per day if every day behaves equally (it will not). Build ethics-compliant rosters from day one; do not underwrite on unpaid labour.
Choose Valley if
You can roster nights with discipline and your concept thrives on entertainment adjacency.
Choose James Street if
You have premium execution proof — not aspirations — and capital to survive slow brand build.
Choose neighbourhood east/reaches if
Your concept wins repeats and you accept lower peak highs for steadier lows.
PROCEED / VERIFY / AVOID
PROCEED (provisionally): format matches precinct dayparts, covers maths clear mid-week, and rent is inside a defensible load after honest labour. VERIFY: event/night spikes dominate the model, or cuisine overlap within 500 m is dense without differentiation. AVOID: underwriting only on Saturday nights or Instagram density.
Compare finalists with the same scorecard — competitors, rent bands, verdict.
Free location score, map, data confidence and PROCEED / VERIFY / AVOID recommendation. Modelled financials stay optional.
Analyse Brisbane addressesSharp conclusion
Brisbane’s “best” suburb is the one where downside weeks still clear wages — after honest rent. Pick precinct using dayparts, not brochures.
Sources & verification
Related reading
Precinct read: the West End suburb guide carries the engine read on Brisbane's strongest independent strip. Live rankings: the engine-scored Brisbane restaurant guide.
Running a café concept instead? the engine-scored Brisbane café guide covers the morning-trade version of these strips.
About the author
Prashant GuleriaFounder, Locatalyze
Prashant builds decision-grade location reports for Australian hospitality and retail operators — bridging mapping data with lease economics.
Tools first — then a full report for your address
Free rent, viability, and break-even checks. Upgrade when you are ready for competitors, map, and numbers for a specific site.
No signup required for tools