Demand 8/10: one of Australia's largest and youngest suburbs — 66,781 residents, a median age of 33 and large families (average household 3.2) — a strongly Indian-and-Chinese diverse base (17.4% Indian ancestry; 14.3% Chinese; 56.1% born overseas) anchored by the Point Cook Town Centre, with notably high household income ($2,392/week) for a growth corridor.
CAUTIONBest fit: Café (72/100)
Location score
66
out of 100
Verdict
CAUTION
Proceed with clear plan
72
Café
64
Restaurant
59
Retail
Factor Breakdown
Location factors
Demand, rent, competition, seasonality, and tourism — scored and weighted for Australian commercial operators.
8/10
Demand
4/10
Rent cost
6/10
Competition
3/10
Seasonality
2/10
Tourism dep
Business-Type Scores
How each format performs
Café / Specialty Coffee72
Full-Service Restaurant64
Independent Retail59
Scores use engine-derived weights: cafés weight demand and rent most heavily; restaurants factor tourism; retail factors tourism and demand equally.
Analyst Notes — Point Cook
What the data says about this location
1
Demand 8/10: one of Australia's largest and youngest suburbs — 66,781 residents, a median age of 33 and large families (average household 3.2) — a strongly Indian-and-Chinese diverse base (17.4% Indian ancestry; 14.3% Chinese; 56.1% born overseas) anchored by the Point Cook Town Centre, with notably high household income ($2,392/week) for a growth corridor.
2
Rent 4/10: low, growth-corridor rents — a cheap cost base that suits a high-volume model serving a vast young family catchment.
3
Competition 6/10: the Point Cook Town Centre concentrates retail and food spend — an independent operator must serve the young, diverse family routine the centre leaves rather than compete head-on.
4
Seasonality 3/10: a year-round residential growth corridor with a modest retail peak — steady demand from a large, young, family-heavy base (86.2% family households).
Suburb commercial location intelligence report
Point Cook: viability before you sign a lease
1. Hero insight
One-line read on what this precinct means for operators.
Point Cook commercial viability is driven by modelled demand strength (8/10), competition saturation (6/10), and commercial lease pressure (4/10) — interpret alongside your café (72/100), restaurant (64/100), and retail (59/100) lines.
2. Location intelligence snapshot
Figures below combine Locatalyze five-factor inputs with precinct editorial interpretation — always validate on-site with trade-area counts before signing a lease.
Demand strength (model)
8/10 — customer intent density for this precinct
Foot traffic intensity (modelled)
High — consistent strip activation
Competition intensity
High — crowded categories; gaps exist with discipline
Elevated — model lease and dayparts before signing
3. Commercial demand analysis
Why people move through this precinct, how spending behaves, and how dayparts shape revenue.
Customer intent scales with the precinct’s demand factor — higher scores imply stronger pedestrian and spending throughput for aligned categories.
Dayparts and category fit still decide outcomes: match menu, roster, and logistics to the strip’s dominant movement patterns rather than suburb stereotypes.
4. Business-type performance
Engine scores plus operator rationale — commercial viability only.
Café / specialty coffee72/100
Engine café line 72/100 weights demand 8/10 and commercial rent pressure 4/10 — stronger where commuter throughput is predictable and competition isn’t purely generic.
Full-service restaurant64/100
Restaurant line 64/100 lifts when tourism 2/10 supports dinner trade and seasonality 3/10 stays manageable for roster planning.
Independent retail59/100
Retail line 59/100 responds to demand × tourism blend — wins where window visibility and category gaps align with walk-by intent.
Services / fitness (proxy)65/100
Services / fitness proxy 65/100 blends retail + hospitality signals — use for gym, salon, and appointment formats where repeat locals matter.
5. Competition & saturation analysis
Where categories crowd out entrants and where disciplined positioning still clears margin.
High — crowded categories; gaps exist with discipline — saturated lanes punish undifferentiated entrants; look for cuisine, experience, or SKU whitespace backed by counts.
Substitution risk rises where neighbouring precincts offer comparable trips at lower friction — differentiation must be operational, not cosmetic.
6. Street-level intelligence
Micro-zones inside the suburb — not uniform throughput.
Structured for search and AI citation — operator viability only (no residential rental advice).
Is Point Cook good for a café?
Screen using the café line (72/100) plus weekday throughput proof — the composite verdict is CAUTION.
Is retail saturated in Melbourne?
Competition intensity is 6/10 — high saturation demands differentiation and SKU velocity.
What business works best?
Compare café (72), restaurant (64), and retail (59) lines — highest score indicates lowest-friction alignment with model weights.
Is foot traffic strong enough?
Demand strength is 8/10 — confirm hourly intent at your intended frontage.
Should I open solely based on this page?
No — this is precinct screening intelligence. Run a Locatalyze address analysis for lease benchmarking and competitor mapping.
Locatalyze scores are engine-derived from demand strength, commercial rent pressure, competition density, seasonality risk, and tourism dependency — each 1–10 — rolled into business-type lines and composite verdicts. This report is commercial location intelligence for operators, not residential market commentary.
Local insight — Point Cook
On-the-ground read for operators
Editorial notes layered on top of the scored model — same scores and benchmarks above; this section translates strip mechanics into decisions.
Local reality check
Demand 8/10: one of Australia's largest and youngest suburbs — 66,781 residents, a median age of 33 and large families (average household 3.2) — a strongly Indian-and-Chinese diverse base (17.4% Indian ancestry; 14.3% Chinese; 56.1% born overseas) anchored by the Point Cook Town Centre, with notably high household income ($2,392/week) for a growth corridor.
Rent 4/10: low, growth-corridor rents — a cheap cost base that suits a high-volume model serving a vast young family catchment.
Competition 6/10: the Point Cook Town Centre concentrates retail and food spend — an independent operator must serve the young, diverse family routine the centre leaves rather than compete head-on.
Engine factors for Point Cook: demand 8/10, rent pressure 4/10, competition 6/10, seasonality risk 3/10, tourism dependency 2/10 — line scores café 72/100, restaurant 64/100, retail 59/100.
Competition is moderate — you are buying into share-of-wallet, not automatic overflow.
Micro-location breakdown
Point Cook main strip / highest visibility
What tends to work: High-throughput food, proven hospitality formats, and retail with clear window narrative.
What struggles: Formats needing highway visibility or large-format parking ratios.
Rent vs foot traffic: Prime band often near $4,314–$5,126/mo — Rent pressure 4/10 — face rents can be approachable, but secondary positions still need a destination hook.
Secondary street / side pocket
What tends to work: Operators who accept lower passer-by counts but fund discovery through product, hours, or events.
What struggles: Walk-in-only models with no marketing budget or brand recognition.
Rent vs foot traffic: Secondary band often near $3,705–$4,314/mo — savings must fund signage and fit-out amortisation, not disappear into rent alone.
Budget / upstairs / off-strip
What tends to work: Studios, appointment services, niche retail with owned traffic.
What struggles: Full-service dining depending on spontaneous footfall without a booking channel.
Rent vs foot traffic: Lower band near $2,408–$3,705/mo — viable only when customers arrive by intent, not accident.
Real business scenarios
If prime rent clears near $4,314–$5,126/mo, model daily covers at your real average ticket — the engine verdict is CAUTION at 66/100, not a guarantee at your address.
Tourism dependency 2/10: when elevated, January and shoulder weeks need explicit planning, not December extrapolation.
Run competitors within 500m before offer — Competition is moderate — you are buying into share-of-wallet, not automatic overflow.
Competitive reality
Point Cook (CAUTION, 66/100) is a modelled read across demand, rent, competition, and seasonality — validate on-site at quiet and peak dayparts, then reconcile with your accountant before lease execution.
Sharp verdict
Point Cook pays off when rent sits inside $4,314–$5,126/mo at conservative revenue — do not sign on suburb hype; sign on covers you can defend on a Tuesday.
Operator's briefing
Point Cook is one of Australia's largest and youngest suburbs — 66,781 residents, a median age of 33, and large families (average household 3.2) — anchored by the Point Cook Town Centre in Melbourne's west. It is strongly Indian-and-Chinese diverse (17.4% Indian ancestry, 14.3% Chinese, 56.1% born overseas) and, unusually for a growth corridor, affluent — a household income of $2,392 a week. Scale, cheap rent and spending power lift the composite to 66/100 with a CAUTION verdict, café the best fit at 72/100. This briefing sets out the catchment and the format that fits.
Point Cook's defining feature is the combination of scale, youth and — unusually for a growth corridor — affluence. With 66,781 residents it is one of the largest suburbs in this cohort and one of the youngest (median age 33, average household 3.2, 86.2% family households). It is strongly diverse — 17.4% Indian ancestry, 14.3% Chinese, 14.9% born in India, 56.1% born overseas — and the household income ($2,392 a week) sits well above the Greater Melbourne median, reflecting the dual-income professional migrant families that have made Point Cook home.
The market is therefore a large, young, family-heavy and culturally diverse one — but with more spending power than a typical mortgage-belt growth suburb. Rents are cheap (4/10), and the retail-and-food geography is dominated by the Point Cook Town Centre, a main-street-themed shopping centre with around 135 specialty shops. The key access fact: Point Cook has no railway station of its own, connected instead by bus to Williams Landing station on the Werribee line. Read this briefing, then position for the young, diverse, relatively affluent family routine the centre leaves.
Point Cook's numbers describe a large, young, diverse and — unusually for a growth corridor — relatively affluent family suburb. At 66,781 residents with a median age of 33, an average household of 3.2 and 86.2% family households, it is a high-household-formation, family-forming population, and a strongly diverse one (17.4% Indian ancestry, 14.3% Chinese, 56.1% born overseas). The household income ($2,392/week) sits well above the Greater Melbourne median, driven by dual-income professional migrant families.
The demand engine is scale plus youth plus a spend premium, on a cheap cost base. The operator implication is a café, family eatery or cuisine-specific format on a neighbourhood strip — serving the young, diverse, relatively affluent family routine the dominant Point Cook Town Centre leaves, priced a notch above pure value. The key qualifier is access: with no internal station, the trade is residential-and-centre-driven rather than commuter-rail-driven.
Figure 1
Point Cook's scale and diversity
Residents (total)66,781
Median age 33; 86.2% family households.
Indian ancestry~11,620
17.4% of residents.
Chinese ancestry~9,550
14.3% of residents.
Source: ABS Census 2021, Point Cook (Vic.) [1]. Counts derived by applying the published shares to the 66,781 resident population; figures are approximate. The Point Cook Town Centre (see references) is the dominant retail anchor.
Scale, youth and unusual affluence
The most important combination in Point Cook is its size, its age profile and its spending power. At 66,781 residents it is a large market in its own right; with a median age of 33, an average household of 3.2 and 86.2% family households, it is young and family-forming; and — unlike most growth corridors — its household income ($2,392/week) sits well above the metropolitan median. That affluence comes from dual-income professional migrant families, particularly the large Indian-Australian community.
For an operator, the implication is a large, young family base with genuine spending power on a cheap cost base. A café, family eatery or quick-service food business banks the everyday routine of tens of thousands of young families, and the above-median incomes mean the ticket can be a notch above a pure value market. The cheap rent (4/10) makes the model work, and the scale plus spend is why the café sub-score reaches a strong 72/100. This is volume and value with an affluence premium.
A strongly Indian-and-Chinese diverse community
Point Cook's diversity is a defining commercial dimension. With 17.4% Indian ancestry, 14.9% born in India, 14.3% Chinese ancestry and 56.1% born overseas, it is one of Melbourne's more diverse large suburbs — and that supports cuisine-specific formats at real depth. Indian and South Asian restaurants, sweets and grocery, Chinese and wider Asian food, and the everyday cuisine of a young diverse community all have a large, growing and relatively affluent base here.
The contest is within categories. An Indian or South Asian operator who executes well, a Chinese or wider Asian eatery, or a grocery serving the diverse base has a natural, sizeable and spending market. The losing move is a generic offer with no cultural read in a community this diverse — or assuming the value-corridor location rules out a quality, culturally aligned offer, when the above-median incomes support exactly that. The diversity plus the spending power is the opportunity for an operator who serves it authentically.
The Town Centre dominates — plan around it
The Point Cook Town Centre is the area's dominant retail-and-food anchor — a main-street-themed centre with around 135 specialty shops, major retail and a large dining-and-grocery offer that concentrates the suburb's comparison-retail and food-court spend. For a sprawling, fast-grown suburb, it is the de facto town centre, pulling the shopping trips into one place.
For an operator, the centre is the strategic fact to plan around. A generic food-court-style offer competing with the centre's tenants loses on range and footfall; what the centre does not own is the neighbourhood routine — the local café before it opens, the cuisine-specific restaurant the chain mix omits, the everyday strips and residential-pocket trade across a vast suburb. The independent opportunity in Point Cook is the young, diverse, relatively affluent family routine the dominant centre leaves, served on the neighbourhood strips and desire-lines the centre does not concentrate.
No station of its own — a bus-connected growth corridor
An important access fact: Point Cook has no railway station within the suburb. It is connected by bus to Williams Landing station on the Werribee line, and the area is heavily car-dependent — typical of a fast-grown outer-western growth corridor. That shapes the trade: the catchment is overwhelmingly the resident base and the centre's draw, rather than a commuter-rail flow passing through.
For an operator, the absence of an internal station means the demand is residential-and-centre-driven, not commuter-rail-driven. There is no station pulse to bank; instead the trade is the everyday family routine, the weekend, and the Town Centre's draw. That favours neighbourhood-and-residential positioning over a commuter grab-and-go format, and reinforces the importance of reading the centre's pull. Position for the resident routine and the cuisine-specific community, not a rail flow the suburb does not have.
The format that fits, in plain terms
The strongest fit is a café or family eatery on a neighbourhood strip away from the Point Cook Town Centre (café 72/100, among the cohort's highest) — built for the large, young, diverse, relatively affluent family base, priced a notch above pure value and run for high-frequency turnover on a cheap cost base. An Indian, South Asian or Chinese restaurant, sweets or grocery reading the diverse community fits the same market well (restaurant 64/100). Children's, family and everyday services — tutoring, activities, allied health — trade on the young, family-forming base.
What does not fit: a generic food offer competing head-to-head with the Town Centre's tenants; a format with no cultural read in a strongly Indian-and-Chinese community; or a commuter grab-and-go format reliant on a rail flow the suburb does not have. Point Cook pairs enormous scale and youth with real diversity, cheap rent and — unusually — above-median spending power: a strong opportunity for an operator who serves the young, diverse, relatively affluent family routine the dominant centre leaves.
Zone-by-zone breakdown
Neighbourhood strips (off-centre)
The local strips away from the Town Centre — the everyday family routine. Works for: cafés, family eateries and cuisine-specific operators. Fails for: generic offers competing head-on with the dominant centre.
Cuisine-specific / community positions
Positions serving the strongly Indian-and-Chinese community. Works for: Indian/South Asian and Chinese restaurants, sweets and grocery. Fails for: generic offers with no cultural read in a diverse market.
Residential pockets
The sprawling new-build residential pockets across a vast suburb. Works for: resident-serving everyday formats, children's and family services. Fails for: commuter formats — Point Cook has no internal station.
Operator Intelligence
10 dimensions — what matters most here
Scored 1–10 from an operator perspective: higher always means better. Each dimension includes the reasoning behind the score.
Scale-and-youth demandCritical
One of Australia's largest, youngest suburbs — 66,781 residents, median age 33, 86.2% family households — a young, family-forming volume base.
8/10
Demand spend (affluence)Critical
Above-median household income ($2,392/week) — unusual for a growth corridor — supports a spend premium over pure value.
6/10
Cultural-market depthImportant
A strongly Indian-and-Chinese community (17.4% Indian ancestry, 14.9% born in India, 14.3% Chinese) supports cuisine-specific formats.
8/10
Cost base (rent)Important
Cheap growth-corridor rents (4/10) — the low cost base makes the high-volume model work.
7/10
Mall capture & no stationSupporting
The Town Centre concentrates spend and the suburb has no internal station — the independent serves the resident routine it leaves.
4/10
When Point Cook trades
Peak and off-peak trading periods
Strong
Weekday morning (06:30–09:30)
School-run and the early family routine across a vast young suburb (car-dependent, no internal station).
Strong
Weekend family (09:00–15:00)
A huge young family base — the everyday and cuisine-specific weekend peak.
Strong
Evening dining (17:30–21:00)
Indian, South Asian and Chinese restaurant trade from a diverse, relatively affluent community.
Moderate
Weekday lunch (11:30–14:00)
Local and neighbourhood-strip trade off the dominant centre.
Operator fit warning
Who should not open in Point Cook
✕
Generic food offers competing head-to-head with the Point Cook Town Centre's tenants.
✕
Formats with no cultural read in a strongly Indian-and-Chinese community.
✕
Commuter grab-and-go formats reliant on a rail flow the suburb does not have.
Best business formats for Point Cook
A café for a huge, relatively affluent young family base
The best-fit format (café 72/100). 66,781 young, family-heavy residents with above-median incomes on cheap rent are a volume engine with a spend premium. A café or family eatery on a neighbourhood strip banks the everyday routine.
Indian, South Asian and Chinese cuisine
With 17.4% Indian ancestry, 14.9% born in India and 14.3% Chinese, Point Cook supports Indian, South Asian and Chinese restaurants, sweets, bakery and grocery at real, growing and relatively affluent depth.
Young-family and everyday services
A young, high-household-formation, 86.2%-family-household base (median age 33) supports children's activities, tutoring, allied health and everyday convenience across a sprawling suburb.
Risks specific to Point Cook
The Town Centre dominates retail
Point Cook Town Centre (~135 shops) concentrates the comparison-retail and food-court spend. A generic offer competing head-on loses — the independent must take the neighbourhood routine the centre leaves.
Cultural alignment matters
In a strongly Indian-and-Chinese community, a generic offer with no cultural read loses to operators who serve the diverse market authentically.
No internal station
Point Cook is bus-connected to Williams Landing with no station of its own, so there is no commuter-rail pulse to bank. The trade is residential-and-centre-driven; a commuter grab-and-go format misreads the geography.
Rent viability bands for Point Cook
Indicative monthly rent envelopes for typical commercial tenancies — what each band buys, where it works, where it does not.
Band
Range
What it buys
Works for
Fails for
Neighbourhood strip (off-centre)
Indicative — growth-corridor tier
A frontage on a local strip serving the everyday family routine away from the dominant centre.
Cafés, family eateries and cuisine-specific operators built for volume.
Generic offers competing head-on with the Point Cook Town Centre.
Cuisine-specific / community position
Indicative — growth-corridor tier
Proximity to the strongly Indian-and-Chinese community.
Indian/South Asian and Chinese restaurants, sweets and grocery.
Generic offers with no cultural read in a diverse market.
In-centre (Point Cook Town Centre)
Indicative — town-centre tier
Footfall inside the dominant centre — at the centre's premium and terms.
National chains and operators who can convert centre-shopper volume.
Independents trying to out-compete the centre on its own terms.
Decision framework
Is your model built for the large, young family base — value-and-volume, with a notch above pure-value spend?
Are you positioned on a neighbourhood strip serving the routine the Point Cook Town Centre leaves, rather than competing with it?
Does your offer read the strongly Indian-and-Chinese community, or fill a clear cuisine gap?
Does your model rely on the resident-and-centre trade rather than a commuter-rail flow the suburb does not have?
Have you modelled rent on growth-corridor comps and the break-even on high-frequency turnover from a large, relatively affluent base?
Point Cook pairs enormous scale and youth with real diversity, cheap rent and — unusually — above-median spending power, but the dominant Town Centre means an operator must serve the neighbourhood routine it leaves. Locatalyze runs an address-level analysis on the exact tenancy: how much of the catchment the centre captures, the real foot traffic on the off-centre strips, the cuisine-specific competing set, indicative growth-corridor rent against your format, and a break-even built on high-frequency turnover from a large, relatively affluent young base. Before you sign in Point Cook, get the scale-and-positioning read right.
For a café or family eatery on a neighbourhood strip away from the Point Cook Town Centre, yes — café is the best-fitting format at 72/100, among the highest of the cohort. A huge (66,781), young (median age 33), family-heavy and — unusually — relatively affluent base on cheap rent is a volume engine with a spend premium. The composite is a strong 66/100 (CAUTION) because the dominant centre and cultural alignment shape the winners.
Why is the café score so high but the verdict CAUTION?
The strong café score (72) comes from enormous scale, youth, cheap rent and above-median incomes — a value-and-volume engine with a spend premium. The CAUTION verdict reflects the dominance of the Point Cook Town Centre in retail, the need for cultural alignment in a diverse market, and the lack of an internal station. The composite of 66 is a strong result for a well-positioned, culturally aware operator.
What rent should I expect in Point Cook?
Low, growth-corridor rents (4/10) — well below the established middle-ring suburbs, which makes a high-volume model work. Off-centre neighbourhood strips are the independent opportunity; in-centre Point Cook Town Centre tenancies carry a premium. The bands here are indicative envelopes — verify comps for the specific tenancy.
Who is the Point Cook customer?
A large, young, diverse, family-heavy and relatively affluent base of 66,781 — median age 33, average household 3.2, 86.2% family households, with a household income ($2,392/week) above the Greater Melbourne median. Strongly diverse: 17.4% Indian ancestry, 14.9% born in India, 14.3% Chinese, 56.1% born overseas. Dual-income professional migrant families predominate.
Why is Point Cook more affluent than other growth corridors?
Its household income ($2,392/week) sits well above the Greater Melbourne median — unusual for a growth suburb — driven by dual-income professional migrant families, particularly the large Indian-Australian community. That gives operators a value-and-volume base with a genuine spend premium, supporting a quality, culturally aligned offer a notch above pure value.
Does Point Cook have a train station?
No — and it matters for positioning. Point Cook has no railway station within the suburb; it is connected by bus to Williams Landing station on the Werribee line, and is heavily car-dependent. So there is no commuter-rail pulse to bank: the trade is residential-and-centre-driven, favouring neighbourhood-and-residential positioning over a commuter grab-and-go format.
Who should not open in Point Cook?
Operators with a generic food offer competing head-to-head with the Point Cook Town Centre's tenants; a format with no cultural read in a strongly Indian-and-Chinese community; or a commuter grab-and-go format reliant on a rail flow the suburb does not have.
Wikipedia, Point Cook Town Centre — main-street-themed centre, ~135 specialty shops; Point Cook bus-connected to Williams Landing station, accessed June 2026. https://en.wikipedia.org/wiki/Point_Cook_Town_Centre
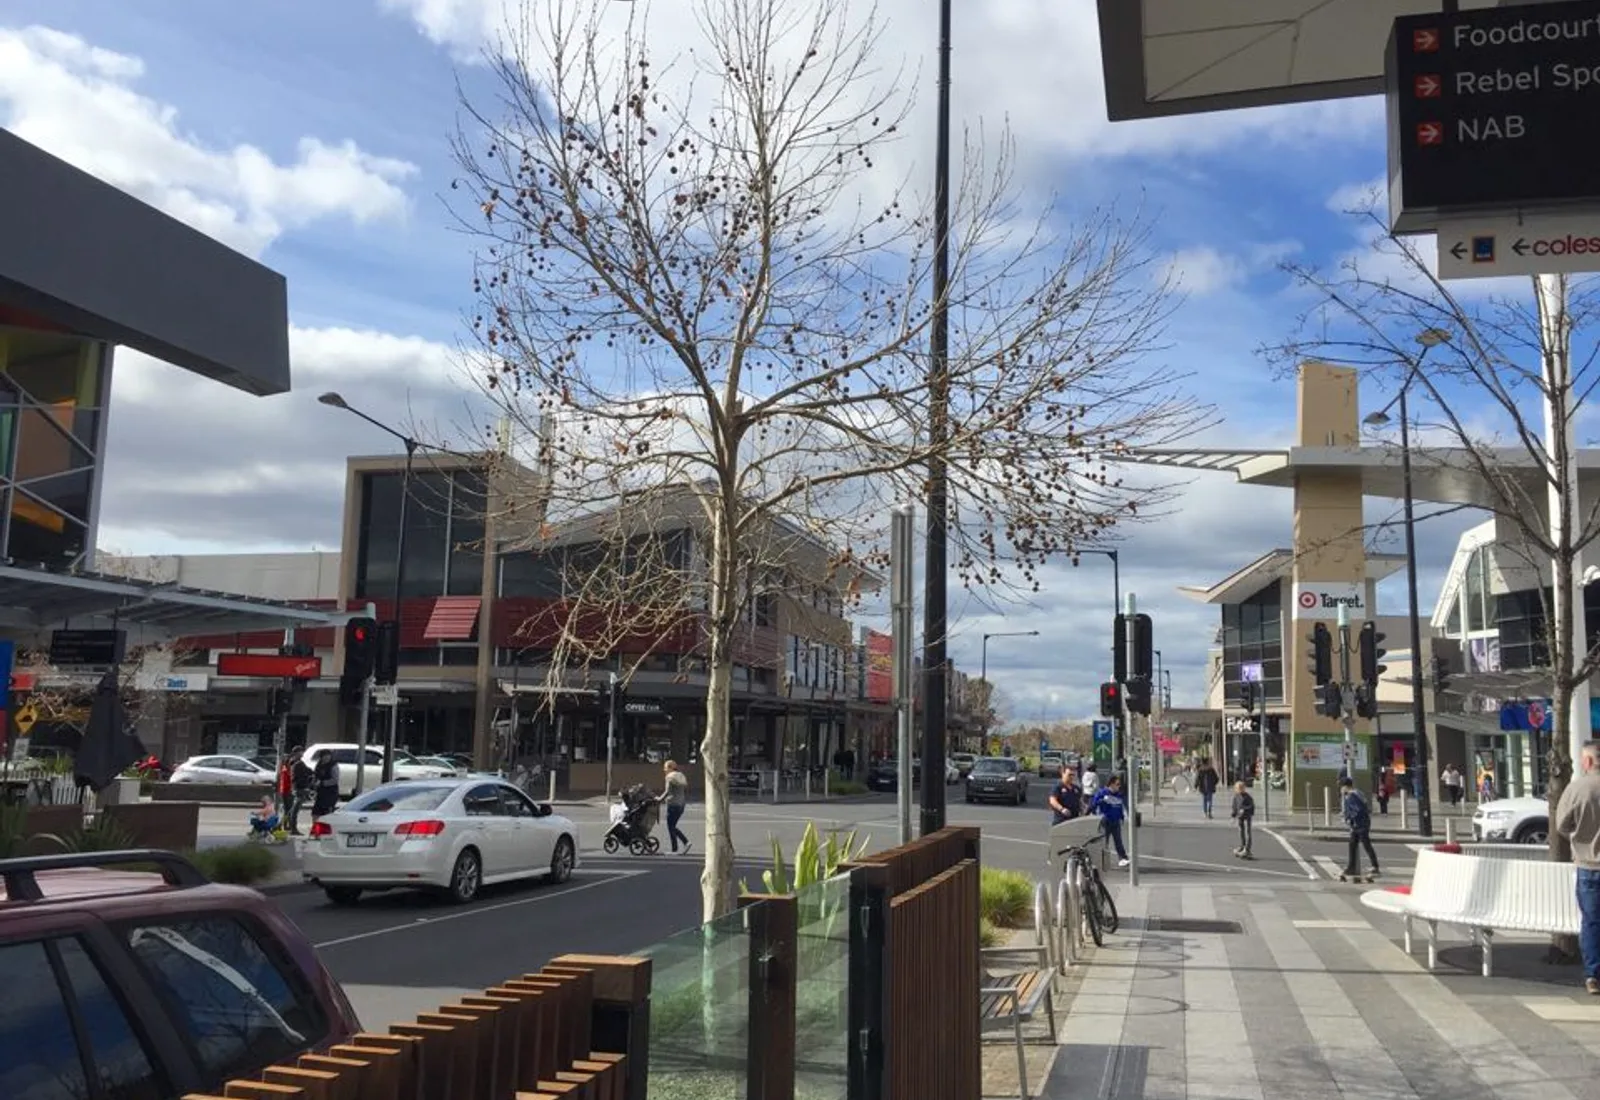
Data provenance & limitations. Demographic figures are from the ABS 2021 Census for the Point Cook (Vic.) suburb (SAL22086), with Greater Melbourne (2GMEL) as benchmark; the 2021 Census is the most recent available. The Point Cook Town Centre's ~135 specialty shops and the no-internal-station / Williams Landing bus connection are from Wikipedia, a secondary link to primary reporting. Ancestry counts in the figure are derived by applying the published percentages to the resident population and are approximate. The photograph dates from 2015 — flagged for human verification. Rent bands are indicative envelopes, not achieved rents — informed by Point Cook's growth-corridor positioning; verify comps for the specific tenancy. Factor scores are relative estimates calibrated across all Locatalyze suburbs, not guarantees of outcome.
Have a specific address in Point Cook?
Run a full competitor map, rent benchmark, and GO/CAUTION/NO verdict for any Point Cook address. Free.