
Melbourne Suburb Intelligence
Why Locatalyze says VERIFY for Melbourne CBD
VERIFY first — Restaurant category score 6.4/10. Location composite 63/100.
Location score
Recommendation
VERIFY
Potentially viable — important checks remain
Melbourne CBD in 30 seconds
Melbourne CBD is VERIFY at 63/100 (café 62, restaurant 64, retail 63). That is a shortlist, not a yes. Prove the named street and daypart before you sign.
Café 62/100 · Restaurant 64/100 · Retail 63/100 — pick the branch that matches your concept before you sign rent.
Laneway evening rooms with a named identity — Tourism 8 and lower weekday-office dependence than Collins Street. ANALYSIS: prove Saturday covers without assuming every laneway is Hosier Lane. The gap is product, not “Melbourne is famous.”
MODEL: those two factors are why composite 63 is VERIFY, not PROCEED. Fame and demand 10 are already in the score. Adding unsourced pedestrian superlatives on top double-counts.
The lease only works on suburb-average foot traffic, weekend trade is unproven at the door, or your concept cannot name a clear reason customers switch from incumbents.
ANALYSIS: the remaining weekday lunch core
VERIFY Melbourne CBD for a named street and daypart. Do not treat demand 10 as permission to skip the rent quote, and do not annualise a Thursday lunch.
Recommendation
VERIFY first
Restaurant category score
6.4/10
Structural risk
High
Competition
Very high (8/10) — Patricia, Brother Baba Budan, Pellegrini’s already hold discovery
Differentiation required
Required
Location composite 63/100 measures overall suburb fit across all factors. Restaurant category score is the format this page recommends. Scores screen the suburb, not the individual lease; the address report checks nearest competitors, rent-to-revenue, and break-even for the exact tenancy.
Should I open a café or restaurant in Melbourne CBD?
Maybe — named street, named daypart, rent that survives Monday. Best-fit restaurant scores 64/100 with composite 63 — inside VERIFY (60–68), below PROCEED (69). Demand is 10/10. Rent 9 and competition 8 are why fame is not a yes. City of Melbourne CLUE jobs in the municipality passed 2019 in 2024; food-and-beverage jobs did not. That is LGA evidence, not a Bourke Street conversion rate.
What surprised me
The Hoddle Grid feels like Australia’s busiest “yes.” Census 2021 household income in the suburb of Melbourne sat below Victoria. The useful investigation is laneway evening rooms with a named identity.
How to read these scores
Composite 63/100; Restaurant 64/100. Use this as a screening verdict before lease diligence.
Source
Locatalyze engine v7.3.0 plus cached local competitor evidence
Freshness
Competitor cache refreshed 27 June 2026
Confidence
Medium - 30 businesses sampled
Limitation
Melbourne CBD scores screen the suburb, not the lease. The paid report tests frontage, rent, nearest competitors, and break-even at your exact address.
Evidence freshness
Scores
Engine v7.3.0; suburb-level model
Competition
Google Places cache refreshed 27 June 2026
Rent
No sourced asking-rent series — obtain current listings
Demographics
ABS Census 2021 baseline with operator interpretation
Precinct map
Mall volume versus Collins Street labour versus laneway evening — pick the P&L first
Bourke Street Mall
Highest occupancy-cost class — verify listings
Retail throughput · chain discovery
Best for: Flagship retail, high-volume food
Collins Street
High — confirm Monday/Friday
Weekday office labour
Best for: Speed, known lunch/coffee offer
Laneways
Below mall — still premium; verify
Evening identity · visitor mix
Best for: Specialty coffee, small dining, bars
Chinatown
Identity street — verify listings
Destination cuisine cluster
Best for: Rooms that belong on Little Bourke
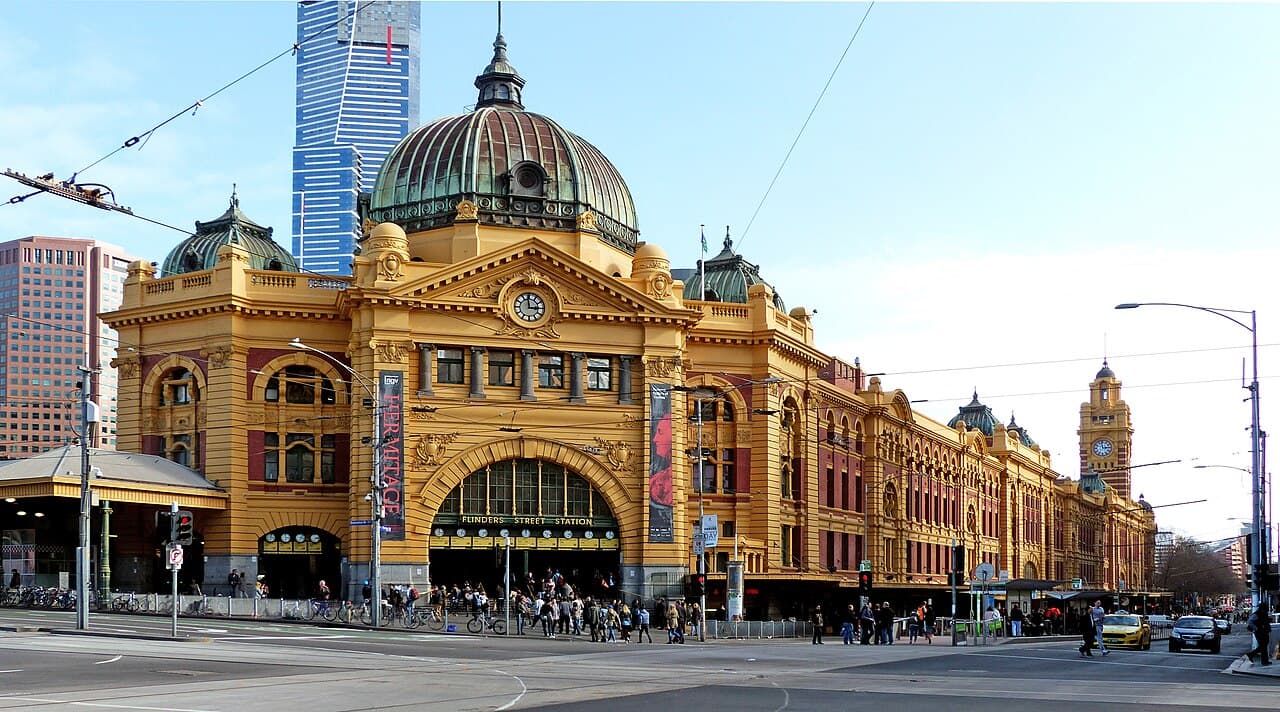
Flinders Street edge
Do not pay mall premiums
Station pulses · thinner discovery
Best for: Convenience, commuter hours
Engine VERIFY is suburb-level. These blocks are different P&Ls. Confirm asking rent; this map does not invent $/m².
Operator fit warning
Who should not open in Melbourne CBD
First independents who need 2019 five-day Collins Street lunch to clear rent 9.
Generic cafés that cannot name which incumbent they displace from the June 2026 snapshot.
Retailers without a volume or brand machine competing for Bourke Street Mall prime.
Decision path
What are you opening?
Pick your format — the guide shows only the branch that applies to your concept.
No dedicated section for this format in the suburb guide — run an address-level analysis for restaurant, retail, or bar economics.
Why do successful venues survive here?
They match street to daypart and convert. Cached cafés within 800 m (27 June 2026) include Patricia Coffee Brewers, Brother Baba Budan, Pellegrini’s Espresso Bar and Roule Galette. ANALYSIS: the hybrid-work stress test. We do not publish an occupancy %. Inspect. Where I would still look: laneway evening rooms with a named identity.
Local competition
Who wins in Melbourne CBD — and where to differentiate
Ranked from cached Google Places data near the suburb centre. Validate at your lease address before signing.
Who wins in Melbourne CBD — Restaurants
Ranked by success score (rating, review depth, centrality) within ~1000m of the suburb centre.
What winners have in common
- ·9 of 10 top venues sit at 4.3★+ — customers reward consistent execution, not novelty alone.
- ·Review depth averages 2,753 — operators with under 150 reviews read as unproven next to incumbents.
- ·Typical positioning is $$ (9 venues report Google price tiers).
- ·7 benchmark operators combine 4.4★+ ratings with 150+ reviews — new entrants need a clear niche, not a me-too menu.
- 77 · Established
1. Left Bank Melbourne Restaurant & Cocktail Bar
★★★★☆ 4.4 (7,719 reviews) · $$ · 824m from centre
- ·4.4★ and 7,719 reviews — customers actively recommend this restaurant.
- ·Review volume 251% above peer average (2,201).
- ·Mid-range positioning with strong review depth — balanced offer, not discount-led.
If you are opening nearby: Left Bank Melbourne Restaurant & Cocktail Bar is the benchmark restaurant here — their 4.4★ and 7,719 reviews beat the 2,201-review peer average — $$ positioning is validated by review depth in this catchment.
- 80 · Dominant
2. MoVida
★★★★½ 4.5 (2,345 reviews) · $$ · 634m from centre
- ·4.5★ with 2,345 reviews — repeat local demand, not one-off visits.
- ·Mid-range positioning with strong review depth — balanced offer, not discount-led.
If you are opening nearby: MoVida (Dominant) shows what execution looks like at this score tier — 4.5★ with 2,345 reviews signals repeat custom, not novelty traffic — $$ positioning is validated by review depth in this catchment.
- 83 · Dominant
★★★★☆ 4.4 (2,736 reviews) · $$ · 288m from centre
- ·4.4★ and 2,736 reviews — customers actively recommend this restaurant.
- ·Mid-range positioning with strong review depth — balanced offer, not discount-led.
- ·Central location (288m from suburb centre) captures pass-by and destination traffic.
If you are opening nearby: Red Spice Road (Dominant) shows what execution looks like at this score tier — 4.4★ with 2,736 reviews signals repeat custom, not novelty traffic — $$ positioning is validated by review depth in this catchment — 288m from centre — frontage on the walkable strip matters.
- 83 · Dominant
4. Rare Steakhouse Midtown
★★★★½ 4.5 (1,586 reviews) · $$$ · 206m from centre
- ·4.5★ with 1,586 reviews — repeat local demand, not one-off visits.
- ·Premium tier ($$$) with deep reviews — customers accept higher spend here.
- ·Central location (206m from suburb centre) captures pass-by and destination traffic.
If you are opening nearby: Rare Steakhouse Midtown (Dominant) shows what execution looks like at this score tier — 4.5★ with 1,586 reviews signals repeat custom, not novelty traffic — $$$ positioning is validated by review depth in this catchment — 206m from centre — frontage on the walkable strip matters.
- 77 · Established
5. Ginza Teppanyaki
★★★★½ 4.5 (1,552 reviews) · $$$ · 512m from centre
- ·4.5★ with 1,552 reviews — repeat local demand, not one-off visits.
- ·Premium tier ($$$) with deep reviews — customers accept higher spend here.
If you are opening nearby: 4.5★ with 1,552 reviews signals repeat custom, not novelty traffic — $$$ positioning is validated by review depth in this catchment — For new entrants: Ginza Teppanyaki holds the premium occasion — pick an under-served format (counter-service, wine bar snacks, or family early dining).
Possible market opportunities
Derived from venue counts and formats in our Google Places snapshot — not a guarantee of demand at your exact address.
- Medium confidenceTourist-friendly lunch spot with local produce story
Reason: Tourism dependency is elevated — visitors want authentic local food without fine-dining price tags.
Who wins in Melbourne CBD — Cafés
Ranked by success score (rating, review depth, centrality) within ~800m of the suburb centre.
What winners have in common
- ·8 of 10 top venues sit at 4.3★+ — customers reward consistent execution, not novelty alone.
- ·Review depth averages 2,589 — operators with under 150 reviews read as unproven next to incumbents.
- ·Typical positioning is $$ (9 venues report Google price tiers).
- ·7 benchmark operators combine 4.4★+ ratings with 150+ reviews — new entrants need a clear niche, not a me-too menu.
- 92 · Dominant
★★★★½ 4.8 (4,318 reviews) · $$ · 444m from centre
- ·4.8★ with 4,318 reviews — repeat local demand, not one-off visits.
- ·0.3★ above the 4.5★ average among top local peers.
- ·Review volume 80% above peer average (2,397).
If you are opening nearby: Patricia Coffee Brewers is the benchmark café here — their 4.8★ and 4,318 reviews beat the 2,397-review peer average — $$ positioning is validated by review depth in this catchment.
- 85 · Dominant
★★★★½ 4.6 (3,076 reviews) · 318m from centre
- ·4.6★ with 3,076 reviews — repeat local demand, not one-off visits.
- ·Central location (318m from suburb centre) captures pass-by and destination traffic.
If you are opening nearby: Dymocks Melbourne (Dominant) shows what execution looks like at this score tier — their 4.6★ and 3,076 reviews beat the 2,535-review peer average — 318m from centre — frontage on the walkable strip matters.
- 86 · Dominant
★★★★½ 4.5 (3,337 reviews) · $ · 88m from centre
- ·4.5★ with 3,337 reviews — repeat local demand, not one-off visits.
- ·Review volume 33% above peer average (2,506).
- ·Value-tier pricing with high volume — wins on convenience and price, not premium experience.
If you are opening nearby: Brother Baba Budan (Dominant) shows what execution looks like at this score tier — their 4.5★ and 3,337 reviews beat the 2,506-review peer average — $ positioning is validated by review depth in this catchment — 88m from centre — frontage on the walkable strip matters.
- 85 · Dominant
4. Roule Galette
★★★★½ 4.7 (2,209 reviews) · $$ · 447m from centre
- ·4.7★ with 2,209 reviews — repeat local demand, not one-off visits.
- ·0.2★ above the 4.5★ average among top local peers.
- ·Mid-range positioning with strong review depth — balanced offer, not discount-led.
If you are opening nearby: Roule Galette (Dominant) shows what execution looks like at this score tier — 4.7★ with 2,209 reviews signals repeat custom, not novelty traffic — $$ positioning is validated by review depth in this catchment.
- 69 · Established
5. Young and Jacksons
★★★★☆ 4.2 (4,692 reviews) · $$ · 548m from centre
- ·4.2★ and 4,692 reviews — customers actively recommend this café.
- ·Rating sits below the 4.5★ peer average — volume or convenience may be doing the work.
- ·Review volume 99% above peer average (2,356).
If you are opening nearby: 4.2★ with 4,692 reviews signals repeat custom, not novelty traffic — $$ positioning is validated by review depth in this catchment — For new entrants: Young and Jacksons is beatable on pastry-forward with a limited hot menu — avoid matching incumbents' full menu breadth.
Who wins in Melbourne CBD — Retail
Ranked by success score (rating, review depth, centrality) within ~1500m of the suburb centre.
What winners have in common
- ·6 of 10 top venues sit at 4.3★+ — customers reward consistent execution, not novelty alone.
- ·Review depth averages 1,391 — operators with under 150 reviews read as unproven next to incumbents.
- ·5 benchmark operators combine 4.4★+ ratings with 150+ reviews — new entrants need a clear niche, not a me-too menu.
- ·Most winners sit within 400m of the suburb centre — frontage on the walkable strip matters.
- 80 · Dominant
★★★★☆ 4.2 (10,982 reviews) · 64m from centre
- ·4.2★ and 10,982 reviews — customers actively recommend this retail.
- ·Review volume 3279% above peer average (325).
- ·Benchmark incumbent — new entrants in this category are measured against this operator.
If you are opening nearby: Myer Melbourne is the benchmark retail here — 4.2★ with 10,982 reviews signals repeat custom, not novelty traffic — 64m from centre — frontage on the walkable strip matters.
- 82 · Dominant
2. Paddy Pallin
★★★★½ 4.6 (524 reviews) · 501m from centre
- ·4.6★ with 524 reviews — repeat local demand, not one-off visits.
- ·0.3★ above the 4.3★ average among top local peers.
If you are opening nearby: Paddy Pallin (Dominant) shows what execution looks like at this score tier — 4.6★ with 524 reviews signals repeat custom, not novelty traffic — For new entrants: Niche or service-led retail beats another generalist shelf near Paddy Pallin.
- 78 · Dominant
3. City Hatters
★★★★½ 4.7 (451 reviews) · 576m from centre
- ·4.7★ with 451 reviews — repeat local demand, not one-off visits.
- ·0.5★ above the 4.2★ average among top local peers.
If you are opening nearby: City Hatters (Dominant) shows what execution looks like at this score tier — 4.7★ with 451 reviews signals repeat custom, not novelty traffic — For new entrants: Niche or service-led retail beats another generalist shelf near City Hatters.
- 73 · Established
4. Outdoor Adventure Stores Melbourne
★★★★☆ 4.4 (425 reviews) · 216m from centre
- ·4.4★ and 425 reviews — customers actively recommend this retail.
- ·Central location (216m from suburb centre) captures pass-by and destination traffic.
If you are opening nearby: 4.4★ with 425 reviews signals repeat custom, not novelty traffic — 216m from centre — frontage on the walkable strip matters — For new entrants: Niche or service-led retail beats another generalist shelf near Outdoor Adventure Stores Melbourne.
- 76 · Established
5. Fast Times Skateboarding
★★★★½ 4.5 (273 reviews) · 290m from centre
- ·4.5★ with 273 reviews — repeat local demand, not one-off visits.
- ·0.2★ above the 4.3★ average among top local peers.
- ·Central location (290m from suburb centre) captures pass-by and destination traffic.
If you are opening nearby: 4.5★ with 273 reviews signals repeat custom, not novelty traffic — 290m from centre — frontage on the walkable strip matters — For new entrants: Niche or service-led retail beats another generalist shelf near Fast Times Skateboarding.
What mistakes do new operators make?
526,772 LGA jobs in 2024 do not walk into a hidden laneway. Before I sign: shortlist Melbourne CBD only if your format matches a named precinct (laneway evening, Chinatown identity, mall volume, or a proven weekday path) and the rent quote still works on a thin Monday. If you need 2019 Tuesday–Friday lunch to make the lease, the engine is already telling you to verify elsewhere first.
Here's what would stop me signing a lease
First independents who need 2019 five-day Collins Street lunch to clear rent 9.
Would I personally invest here?
I would only recommend this with moderate confidence — restaurant 64/100 is VERIFY, not PROCEED. Rent 9 still has to work on a thin Monday.
I would back a named-street restaurant with weekday or evening proof and a rent quote that survives a thin day. I would not back a first independent because “Melbourne is busy.” VERIFY Melbourne CBD for a named street and daypart. Do not treat demand 10 as permission to skip the rent quote, and do not annualise a Thursday lunch.
Best-fit restaurant 64/100 · composite 63/100 VERIFY (café 62, restaurant 64, retail 63). Demand 10 is already in the model — do not add unsourced footfall on top.
Suburb VERIFY means Melbourne CBD is a conditional shortlist. It cannot see your rent quote or nearest rival. Analyse the exact shopfront next.
Format-by-format depth, comparisons, and FAQsExpand for zones, rent bands, trading windows, format depth, comparisons, and due-diligence FAQs.
Check an address in Melbourne CBD
Melbourne CBD looks workable at suburb level for some formats. Your lease still needs demand, competition and rent fit at a specific frontage — not the suburb average.
Analyse a Melbourne CBD address free