How Franchise Location Teams Choose Sites — And What Independents Can Copy
Founder, Locatalyze
National franchise brands rarely pick sites on vibe alone. They run trade-area, traffic and rent-to-revenue tests before they commit. Independents cannot copy every proprietary model — and should not invent McDonald’s-level precision they do not have — but they can copy the discipline: define the trade area, count the right traffic, and refuse rents the format cannot carry.
Evidence standard
Franchise site-selection workflows described here are LOCATALYZE ANALYSIS of common industry practice — not leaked brand playbooks. Specific ‘3-minute drive time’ claims are industry lore / INFERENCE unless a primary brand methodology is cited. Rent-to-revenue tests should be cross-checked against ATO small-business rent÷turnover bands where the format is coffee/QSR-adjacent. Worked examples are MODELS. Franchise brand rules of thumb (e.g. drive-time lore) are INFERENCE / industry practice unless the franchisor methodology is opened.
What franchise location teams actually analyse
A major franchise's location team analyses five categories before approving any new site: trade area demographics (who lives or works within driveable distance), traffic counts (both vehicle and pedestrian), competitive landscape (how many similar brands are present and how well-traded they appear), rent-to-revenue modelling (does the projected trade support the lease cost), and cannibalism risk (would this new site pull customers from an existing company location). Most franchise systems require a site to clear every category before approval — one failing metric is enough to kill an otherwise attractive location.
Trade area models: the numbers franchises actually use
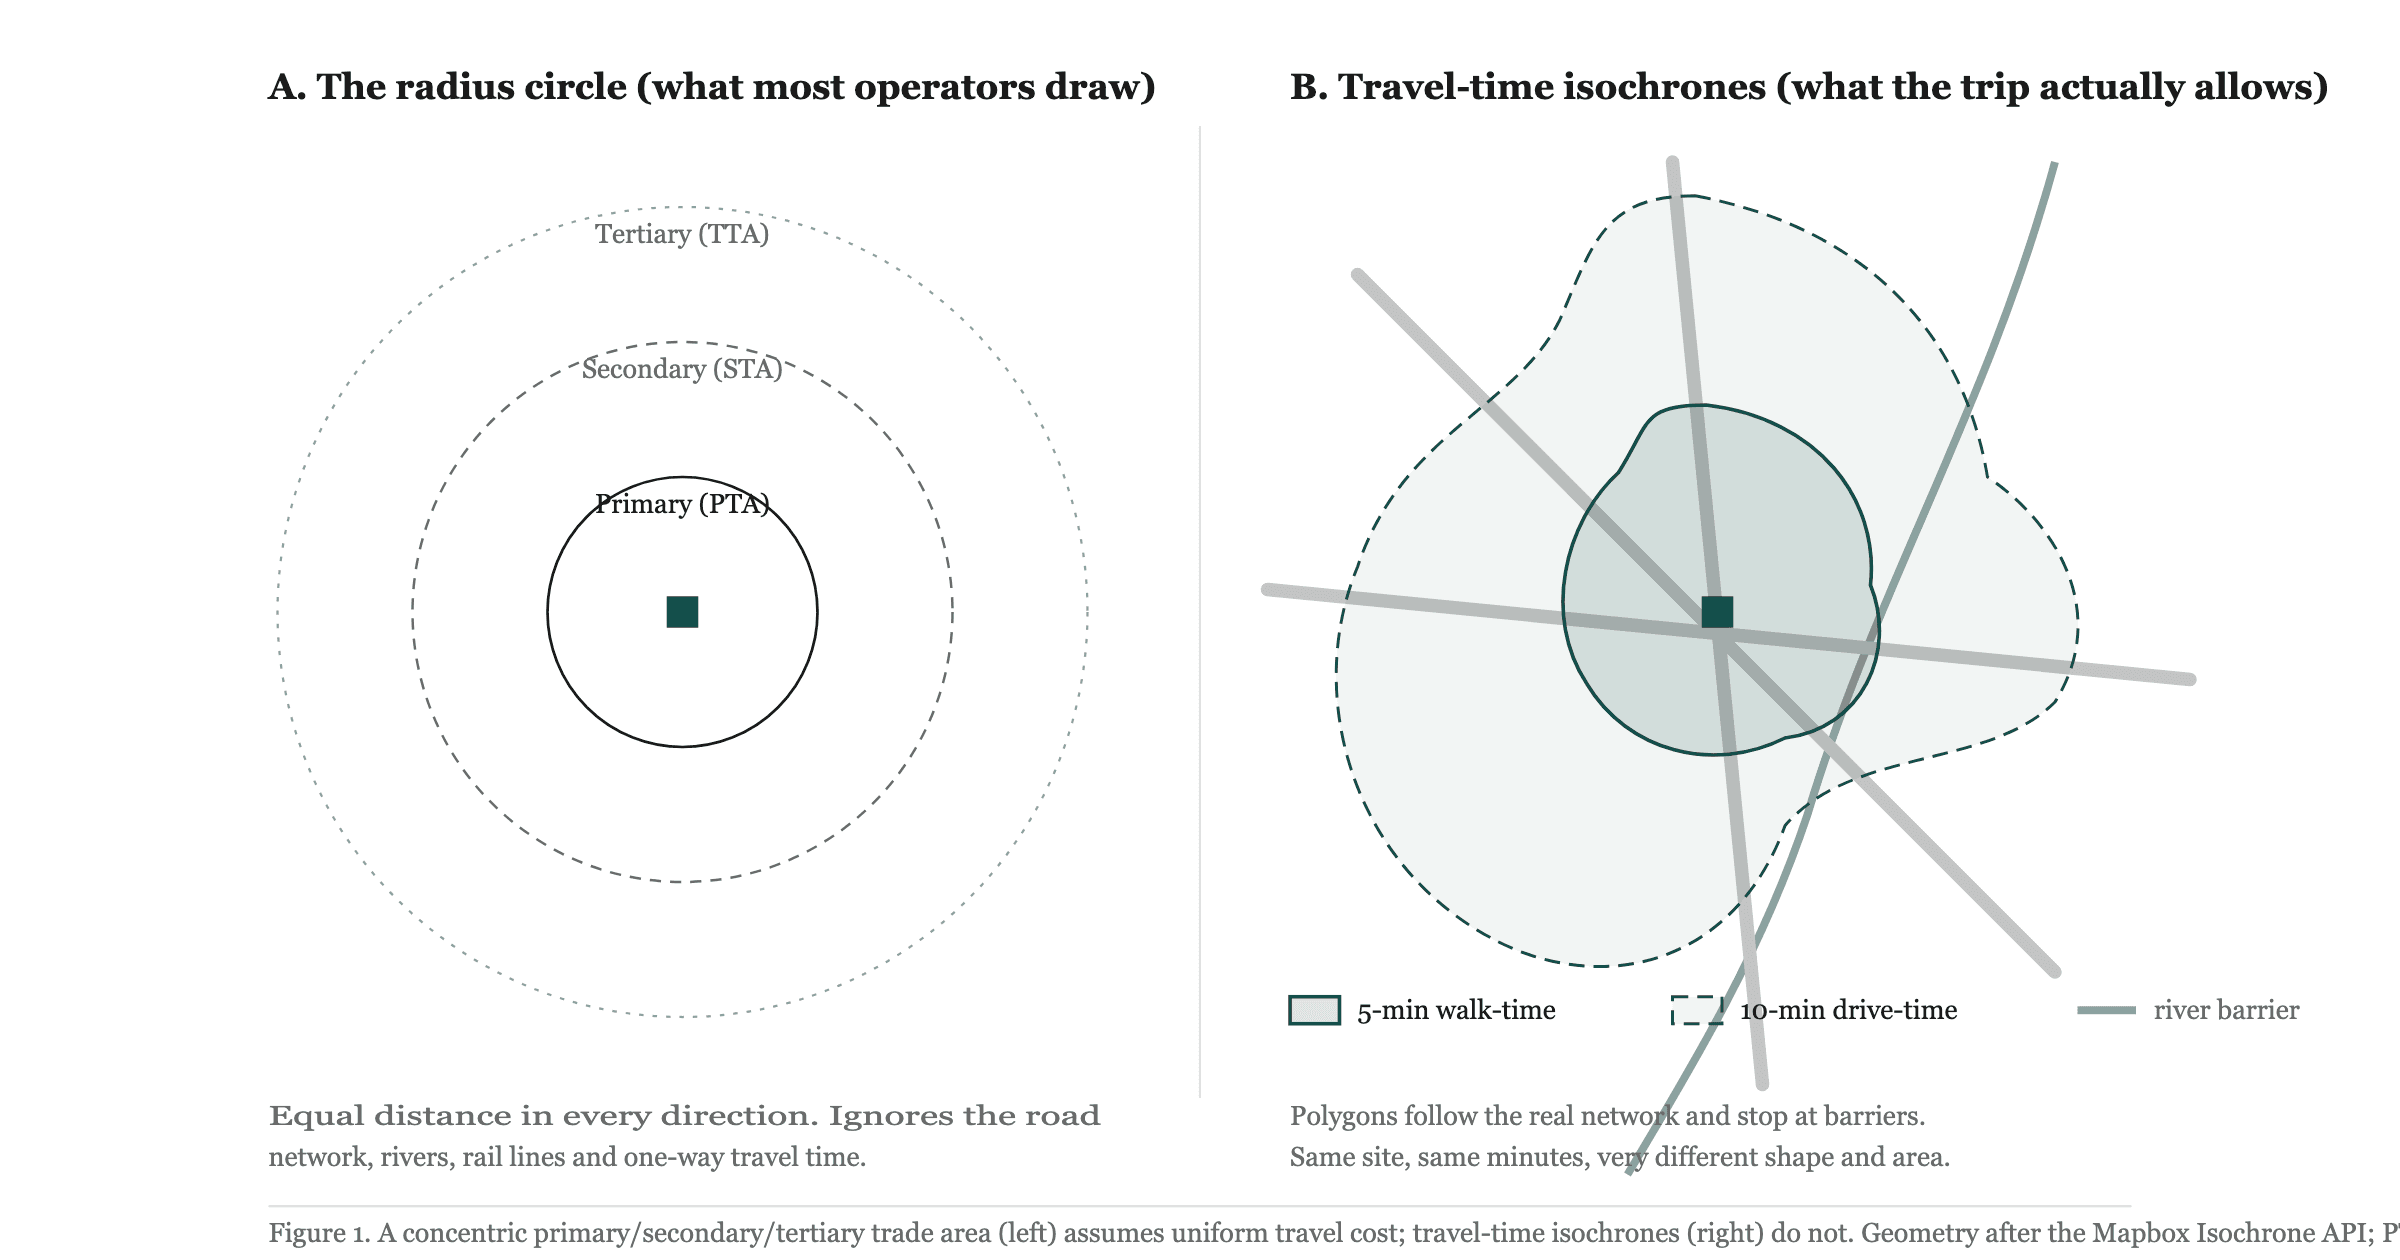
LOCATALYZE ANALYSIS of common practice: many retail systems speak in primary / secondary / tertiary trade areas (often illustrated as roughly most / some / residual customers). Exact 80/15/5 splits are teaching shorthand, not a universal ABS statistic. Serious brands derive radii from their own customer data; independents should start from format norms, then adjust with isochrones — see catchment vs trade-area analysis.
Table provenance: radii and population screens are ESTIMATE / LOCATALYZE ANALYSIS starting points synthesised from common site-selection practice — not ABS thresholds and not an opened brand playbook.
These thresholds are starting points, not guarantees. A café in a CBD office precinct may need only 800m of trade area because the daytime worker density is so high. A boutique gym in an affluent low-density suburb may draw members from 8–10 km because the nearest comparable facility is far away. The model is a filter, not a formula.
Drive-time rules of thumb (often attributed to QSR brands)
INFERENCE / industry lore (not an opened McDonald’s Australia methodology document for this article): QSR site selection is often described as drive-time based rather than a fixed radius, because arterial access changes how many households you reach in a few minutes. Treat any specific ‘3-minute / 15,000 people’ figure circulating in trade conversation as unverified unless the franchisor publishes it. What independents can copy is the discipline: define reach by time, count population and daytime workers inside that reach, and refuse sites that fail rent-to-revenue.
The franchise location checklist adapted for independents
1. Define primary reach by walk- or drive-time for your format (table below = ESTIMATE starting points). 2. Pull ABS population / income for that area (QuickStats / TableBuilder) — FACT with census year. 3. Separate daytime workers where lunch trade matters (Working Population Profile where available). 4. Map direct competitors inside ~1.5× primary reach. 5. Model all-in rent ÷ conservative revenue; for coffee-adjacent formats sanity-check ATO rent÷turnover bands. 6. Ask cannibalisation vs complementarity honestly. Table population thresholds are ESTIMATES for screening — not franchisor guarantees.
Traffic counts: what franchises measure and how you can approximate it
Major brands pay for vehicle traffic count data from traffic authorities and pedestrian count data from council infrastructure records. They correlate traffic volume with observed trading levels at comparable sites to project revenue potential. Most state road agencies publish average daily traffic (ADT) counts on their websites — this data is free and covers major roads. For pedestrian counts, capital city councils (City of Melbourne, City of Sydney) publish annual pedestrian sensor data that covers key shopping strips.
MODEL / operator practice (not a published franchise standard opened here): pedestrian-heavy coffee concepts often need a dense peak-hour pass rate; QSR concepts often need stronger continuous flow. Do not treat 150/hour or 300/hour as FACT thresholds — convert your rent into required transactions and reverse into the footfall you must convert. City of Melbourne and City of Sydney publish open pedestrian counts for some strips; state road agencies publish ADT for many arterials.
Rent-to-revenue: the financial test every franchise applies
Before any franchise approves a site, it must clear a rent-to-revenue test. This is the lease cost as a percentage of projected annual revenue. The approved range varies by brand and business type, but the benchmarks used across the industry are consistent.
Table provenance: maximum rent-to-revenue bands are ESTIMATE / industry practice screens — not ATO FACT (ATO publishes coffee-shop rent÷turnover observed ranges, which overlap the café row as a sanity check only). Gym 15–20% is especially format-sensitive; model membership yield before treating it as safe.
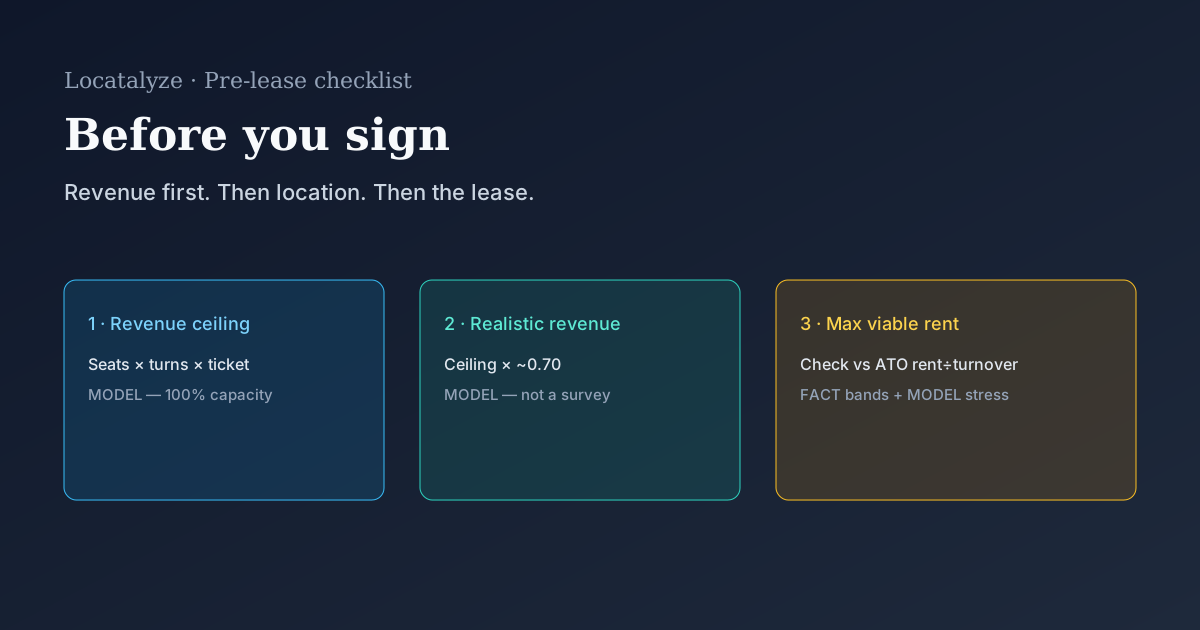
For an independent operator, this test is just as important as for a franchise. A café paying $5,000/month in rent needs to project at least $40,000–$50,000/month in revenue to sit within the acceptable range. If the location cannot support that revenue based on trade area analysis, the economics will not work regardless of how good the coffee is.
Why franchises sometimes get it wrong
Even well-resourced systems mis-calibrate. Historical reporting on Starbucks Australia’s late-2000s store closures is often cited as a caution that US-calibrated models can clear trade-area screens and still fail Australian café culture — treat the specific store-count narrative as secondary reporting unless you open a primary filing. The usable lesson for independents: calibrate on Australian comps and counted local demand, not overseas averages.
The independent advantage: locations franchises cannot take
Independent operators can access locations that franchise systems are structurally unable to approve. Franchise networks often impose minimum footprint and parking rules (ESTIMATE / operator practice: many QSR approvals favour larger plates with dedicated parking — treat any specific ‘150sqm+’ figure as a screen, not a published national rule), brand consistency standards that exclude heritage buildings and unusual formats, and cannibalism rules that prevent opening near existing franchisees. This creates a genuine opportunity class for independents: laneways, small-format premises under 80sqm, emerging suburbs before rents rise, and locations inside other businesses. None of these sites would pass a typical franchise approval process. All of them can work for a well-capitalised independent with the right concept.
Where independents beat franchises on location
Laneways and small-format sites under 80sqm — franchise minimum footprints exclude these Emerging suburbs before rents rise — franchise systems require proven trading history Heritage and unusual buildings — brand standards prevent franchise approval Residential-commercial hybrid formats — not compatible with franchise operating models Concession inside complementary businesses — franchisors prohibit this for most systems
PROCEED / VERIFY / AVOID
PROCEED (provisionally): you can define primary reach by time, pull ABS population/income for that area, and clear a labelled rent-to-revenue model with conservative revenue. VERIFY: the site only works if you assume franchise-style traffic or population thresholds you have not counted yourself. AVOID: copying overseas brand lore (drive-time population rules, rent caps) as FACT without an opened Australian franchisor playbook or your own counted demand.
Run a trade area analysis on any Australian address — the same data franchise location teams use, available to independent operators in typically 2–4 minutes.
Free location score, map, data confidence and PROCEED / VERIFY / AVOID recommendation. Modelled financials stay optional.
Analyse your addressSources & verification
Related reading
About the author
Prashant GuleriaFounder, Locatalyze
Prashant writes location-selection practice for Australian operators — separating opened method from franchise lore.
Tools first — then a full report for your address
Free rent, viability, and break-even checks. Upgrade when you are ready for competitors, map, and numbers for a specific site.
No signup required for tools